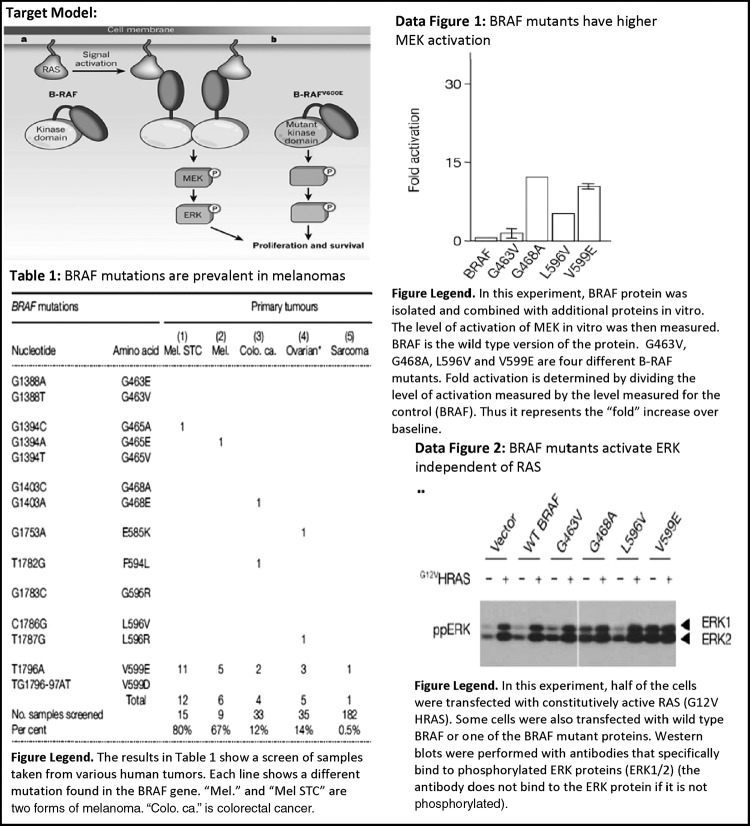
Figure 3.
Examples taken from the RTK Signaling in-class problem set. Target model image was taken from a review article (Lavoie and Therrien, 2011); data images were taken from a published research article (Davies et al., 2002). Figure legends were written by the course instructor and were provided to students. The target model on the problem set shows the normal signaling cascade of RAS→BRAF→MEK→ERK compared with a BRAF mutant that activates its downstream effectors independent of its upstream activator, RAS, thereby promoting cell proliferation and survival. Data Table 1 demonstrates the high incidence of certain mutations in BRAF in melanoma tissue samples. The bar graph in Data Figure 1 shows higher bars (indicating activation of MEK) for certain BRAF mutants listed on the x-axis. The Western blot in “Data Figure 2” is measuring the change in ERK phosphorylation with and without the presence of a constitutively active RAS and with the addition of various mutant forms of BRAF. The data figure demonstrates how the RTK signaling cascade can be short-circuited with a mutant BRAF activating its downstream effectors (MEK and ERK) in the absence of upstream RAS signaling.

