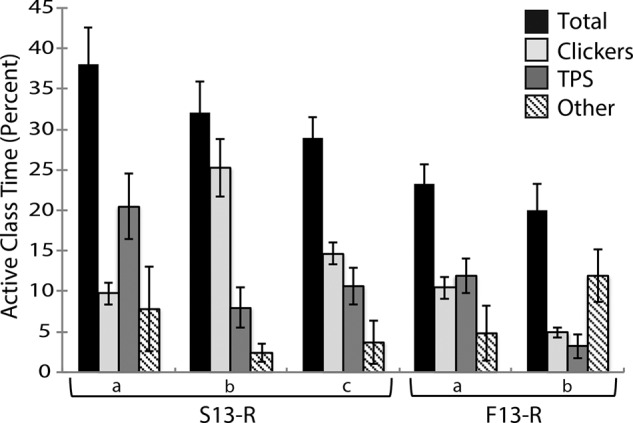
Figure 2.

Use of active learning in reform sections. Bars represent average percentage of class time (± SEM) used for active-learning strategies in reform sections from the Spring of 2013 (S13-R) and the Fall of 2013 (F13-R). The three reform sections in Spring 2013 are labeled “a,” “b,” and “c.” The Fall 2013 reformed sections are labeled “a” and “b.” Different sections were taught by unique instructor teams (Table 1). Percentages were calculated as the percent of time dedicated to active-learning strategies per day, averaged across all class sessions for each section. Percentages are shown for total active-learning time (sum of all activity types, black bars), clicker questions (light gray bars), think–pair–shares (TPS; dark gray bars), and other (patterned bars). Other includes longer group problem-solving activities. Data represent values from more than 75% of all class sessions.
