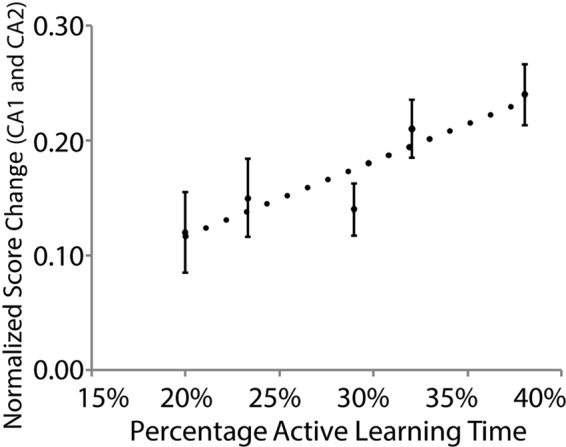
Figure 5.

Student learning gains are positively correlated with the amount of class time dedicated to active learning. Normalized score change on all content questions (CA1 and CA2) by the percentage of class time dedicated to active learning. Data are from Spring 2013 and Fall 2013. The dotted line represents the linear regression line (y = 0.12x − 0.043; R2 = 0.78; p = 0.046).
