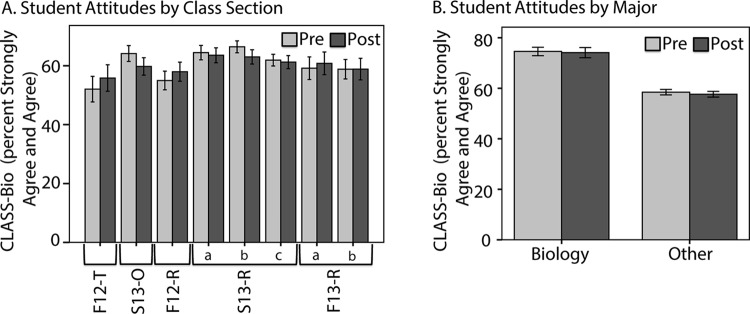
Figure 6.
Student attitudes toward learning biology. Bars represent average student CLASS-Bio scores (± SEM) before (light gray) and after (dark gray) instruction comparing (A) sections and (B) declared majors. F12-T, traditional Fall 2012 lecture; S13-O, Spring 2013 online section; F12-R, S13-R, and F13-R represent reform sections from Fall 2012, Spring 2013, and Fall 2013, respectively. The three reform sections in Spring 2013 are labeled “a,” “b,” and “c.” The Fall 2013 reformed sections are labeled “a” and “b.” There are no significant differences between the preinstruction score or the postinstruction score between specific sections (one-way ANOVA, Scheffé post hoc comparison, all p > 0.17). The “biology” major bars encompass biology, genetics, and microbiology majors. Preinstruction and postinstruction CLASS-Bio scores are not significantly different across any section or major.

