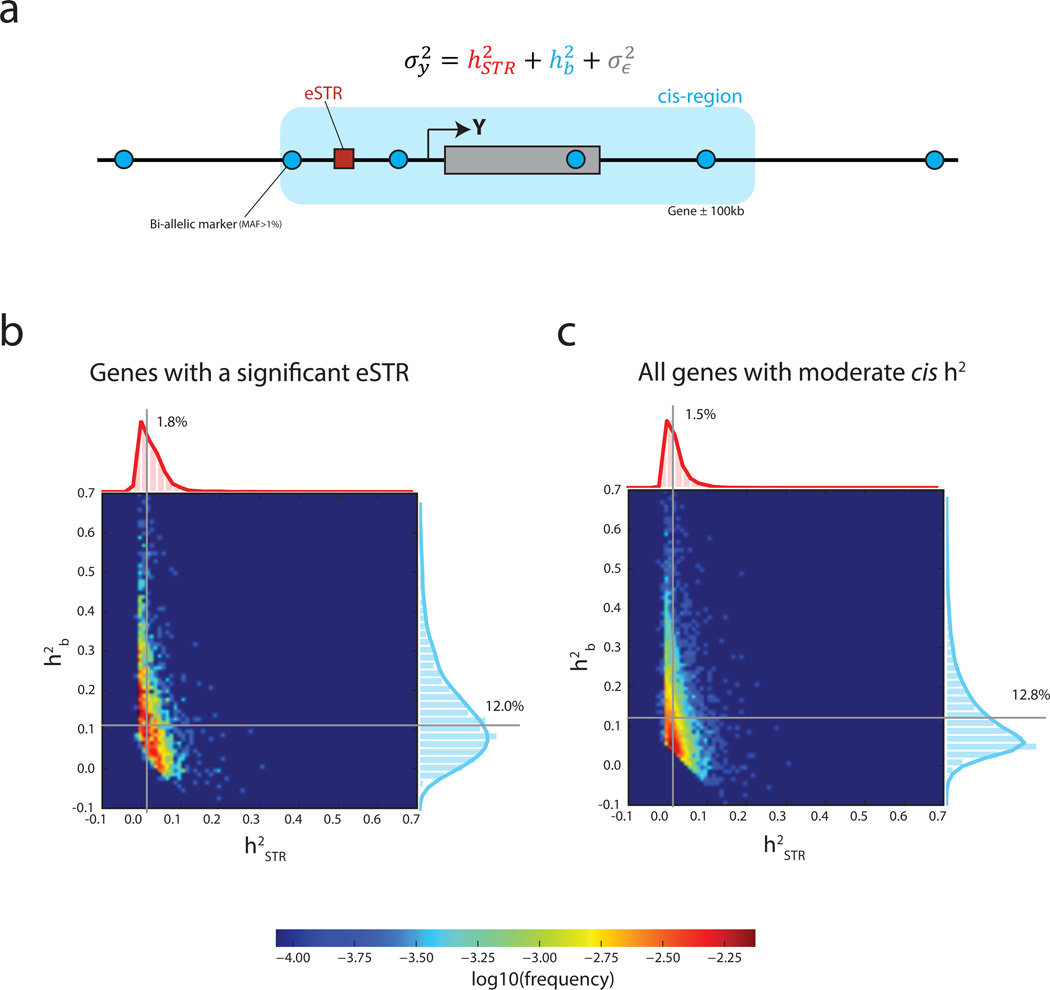
Figure 2. Variance partitioning using linear mixed models.
(a) The normalized variance of the expression of gene Y was modeled as the contribution of the best eSTR and all common bi-allelic markers in the cis region (±100kb from the gene boundaries) (b–c) Heatmaps show the joint distributions of variance explained by eSTRs and by the cis region. Gray lines denote the median variance explained (b) Variance partitioning across genes with a significant eSTR in the discovery set and (c) Variance partitioning across genes with moderate cis heritability.

