Figure 1.

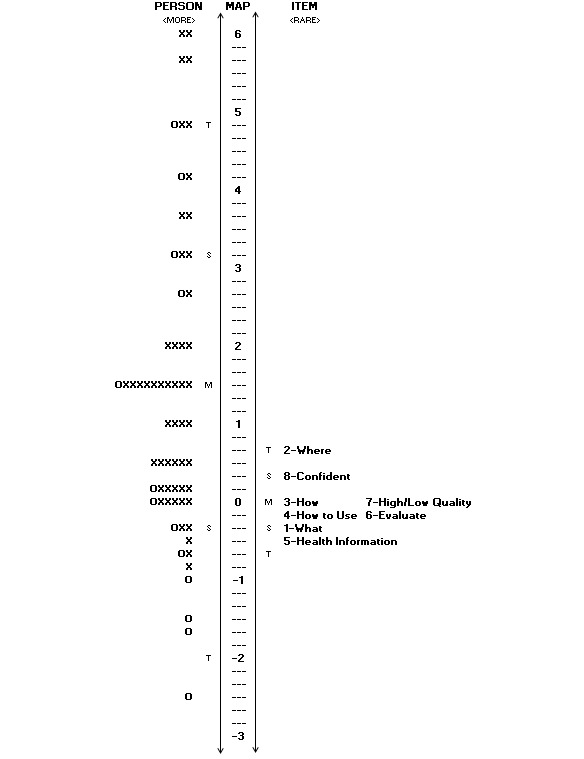
Person ability item-difficulty match of the college sample. Persons are on the left of the line, whereas the item difficulty map is to the right of the line. Each “O” represents 1-2 individuals, whereas each “X” represents 3 persons.

Person ability item-difficulty match of the college sample. Persons are on the left of the line, whereas the item difficulty map is to the right of the line. Each “O” represents 1-2 individuals, whereas each “X” represents 3 persons.