. 2016 May 23;5:e15887. doi: 10.7554/eLife.15887

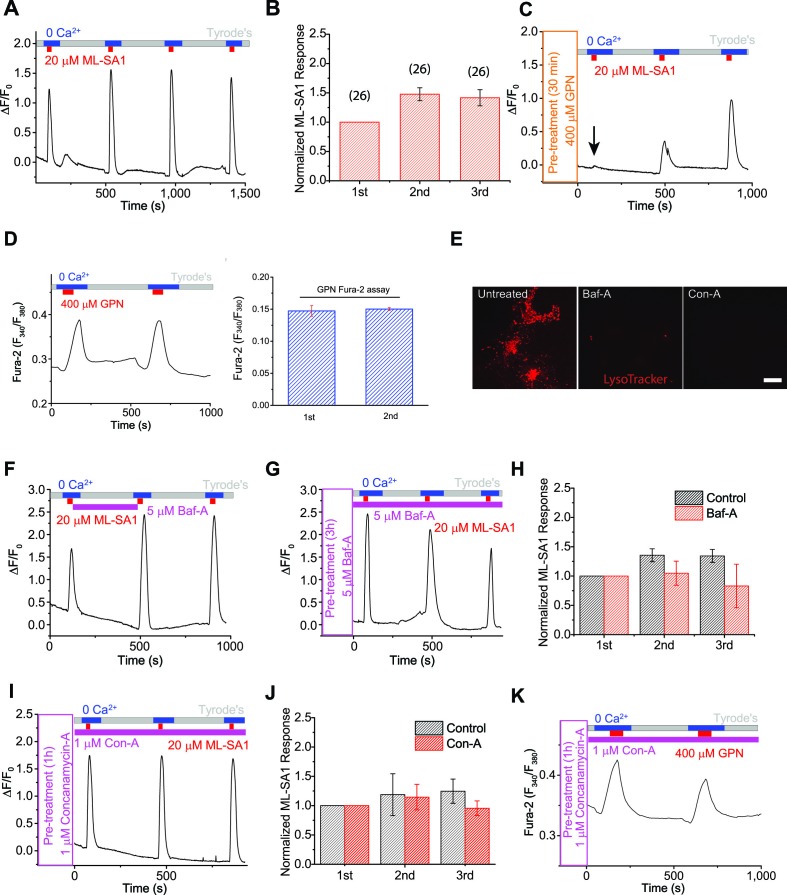
Figure 1. The proton gradient of the lysosome is not required for lysosomal Ca2+ store refilling.

(A) In HEK293 cells stably expressing GCaMP3-ML1 (HEK-GCaMP3-ML1 cells), bath application of the ML1 channel agonist ML-SA1 (20 µM) in a low or 'zero' Ca2+ (free [Ca2+]<10 nM) external solution induced an increase in GCaMP3 fluorescence (F470). After washout for 5 min, repeated applications of ML-SA1 induced responses that were similar to or larger than the first one. Note that because baseline may drift during the entire course of the experiment (up to 20 min), we typically set F0 based on the value that is closest to the baseline. (B) The average Ca2+ responses of three ML-SA1 applications at intervals of 5 min (n=26 coverslips; Figure 1source data 1). (C) Pre-treatment with lysosome-disrupting agent GPN for 30 min abolished the response to ML-SA1 in HEK-GCaMP3-ML1 cells. Washout of GPN resulted in a gradual re-appearance of ML-SA1 responses. See quantitation in Figure 1—figure supplement 2K. (D) Repeated applications of GPN resulted in Ca2+ release that was measured with the Ca2+-sensitive dye Fura-2 (F340/F380) in non-transfected HEK293T cells. (E) Application of Bafilomycin-A (Baf-A, 5 µM) and Concanamycin-A (Con-A, 1 µM) quickly (<5 min) abolished LysoTracker staining, an indicator of acidic compartments. (F) Acute application of Baf-A (5 µM) for 5 min did not block Ca2+ refilling of lysosomes in HEK-GCaMP3-ML1 cells. (G) Prolonged pre-treatment (3 hr) with Baf-A did not block Ca2+ refilling of lysosomes. (H) Quantification of 1st (p value = 0.11), 2nd (p=0.01), and 3rd (p=0.004) ML-SA1 responses upon Baf-A treatment (n=8) compared to control traces (n=6; Figure 1source data 1). (I) Prolonged treatment (1 hr) with Con-A did not prevent lysosomes from refilling their Ca2+ stores. (J) Quantification of 1st (p=0.90), 2nd (p=0.33), and 3rd (p=0.66) ML-SA1 responses with Con-A pre-treatment (n=3; Figure 1source data 1). (K) Con-A did not reveal differences in Ca2+ refilling responses to repeated applications of GPN in untransfected HEK293T cells. Panels A, C, D, F, G, I, and K are the average of 30–40 cells from one representative coverslip/experiment. The data in panels B, H, and J represent mean ± SEM from at least three independent experiments.

DOI: http://dx.doi.org/10.7554/eLife.15887.002

Figure 1—source data 1. Source data of Figure 1B, H, J: The average Ca2+ responses to ML-SA1 applications under control (B), Baf-A1 treatment (H), and Con-A treatment (J).
DOI: 10.7554/eLife.15887.003

Figure 1.

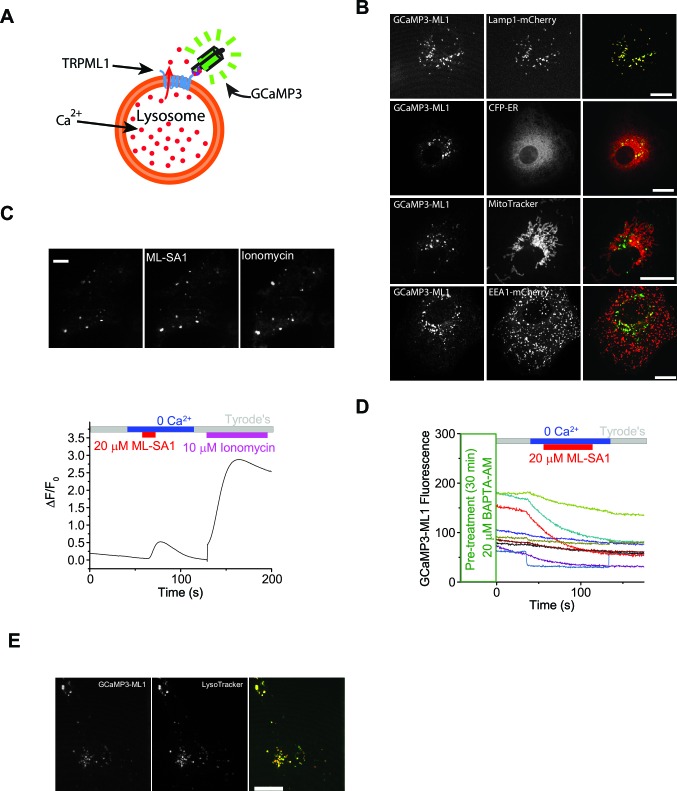
Figure 1—figure supplement 1. A lysosome-targeted genetically-encoded Ca2+ indicator to measure lysosomal Ca2+ release, store depletion, and refilling.

Figure 1—figure supplement 1.

(A) Detection of lysosomal Ca2+ release by a genetically-encoded Ca2+ indicator (GCaMP3) fused directly to the N-terminus of ML1 (GCaMP3-ML1). (B) Co-localization analyses between GCaMP3-ML1 and various organellar markers, including Lamp1-mCherry, CFP-ER, Mito-tracker, and EEA1-mCherry. Scale bars = 5 μm. (C) In an HEK-GCaMP3-ML1 cell, both ML-SA1 and subsequent ionomycin induced GCaMP3 fluorescence increases in lysosomes shown by both fluorescence imaging and Ca2+ imaging. (D) BAPTA-AM pre-treatment abolished ML-SA1-induced responses in HEK-GCaMP3-ML1 cells. Panel C shows the average response of 30–40 cells from one representative experiment. (E) Cos7 cells transfected with GCaMP3-ML1 show strong co-localization with LysoTracker, which is highly selective for acidic organelles.
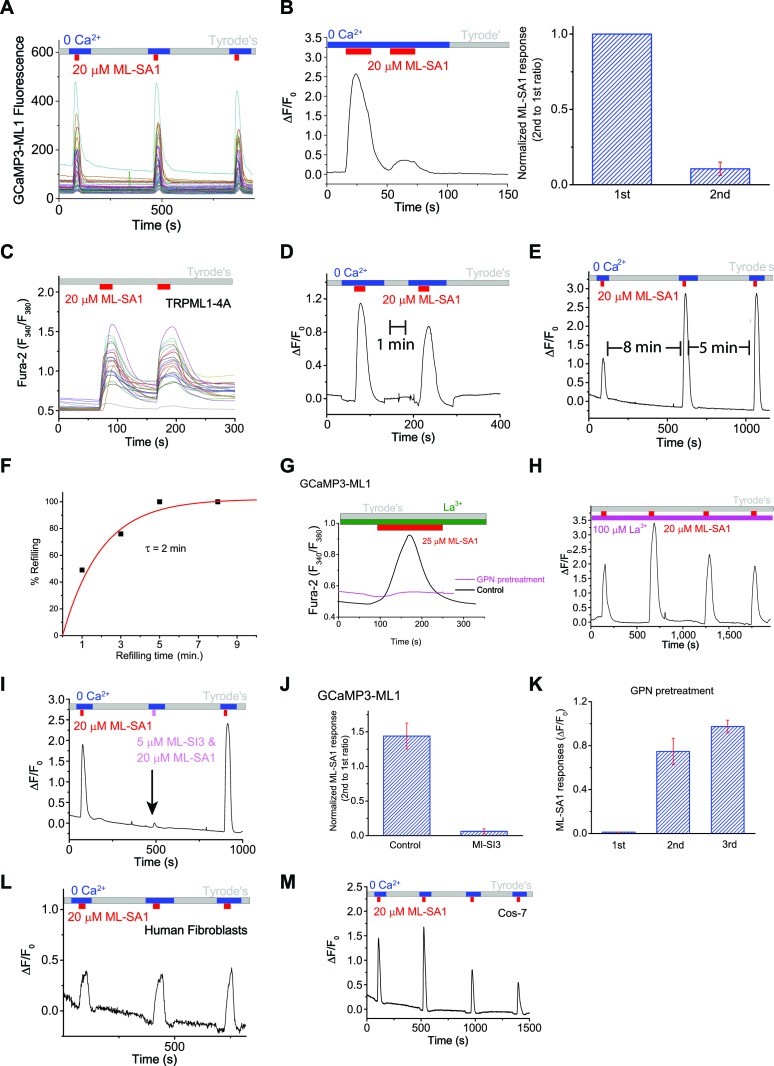
Figure 1—figure supplement 2. An assay to monitor lysosomal Ca2+ store depletion and refilling.

Figure 1—figure supplement 2.

(A) Raw traces of ML-SA1-induced GCaMP3 Ca2+ responses of individual HEK-GCaMP3-ML1 cells on one coverslip. (B) Immediate re-application of ML-SA1 showed a nearly-abolished lysosomal Ca2+ release. (C) In HEK293T cells transfected with surface-expressed TRPML1-4A channels, repeated applications of ML-SA1 induced comparable responses. (D) After 1 min refilling time, application of ML-SA1 in HEK-GCaMP3-ML1 cells induced responses that were smaller than the first one. (E) The amount of Ca2+ released after 8 min of washout and refilling was similar to the amount released after 5 min. (F) Time-dependence of lysosomal Ca2+ store refilling. (G) In the presence of La3+ (100 μM), a membrane-impermeable TRPML blocker, GPN pretreatment abolished ML-SA1-induced responses in HEK-GCaMP3-ML1 cells. (H) Lysosomal Ca2+ refilling in the presence of La3+. (I) ML-SI3 (5 μM) reversibly inhibited ML-SA1-induced Ca2+ responses in HEK-GCaMP3-ML1 cells. (J) Normalized ML-SA1 responses with and without co-application of MI-SI3. (K) Quantification of ML-SA1 responses shown in Figure 1C. (L) Lysosomal Ca2+ refilling in human fibroblasts transfected with GCaMP3-ML1. (M) Lysosomal Ca2+ refilling in Cos-7 cells transfected with GCaMP3-ML1. Panel B, D, E, G, H, I, L and M show the average response of 30–40 cells from one representative experiment out of at least independent repeats.
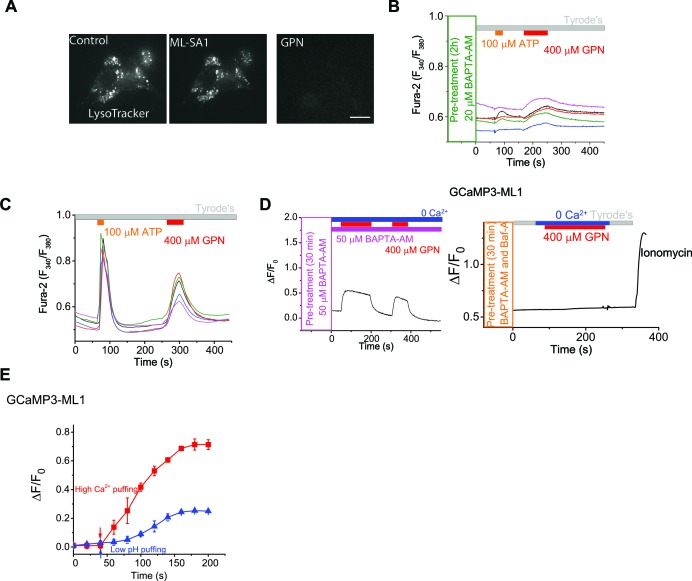
Figure 1—figure supplement 3. GPN and ML-SA1 have different effects on lysosome pH and GCaMP3 fluorescence.

Figure 1—figure supplement 3.

(A) LysoTracker staining was not affected by ML-SA1 (20 μM), but was abolished by GPN (400 μM). Scale bar = 15 µm. (B) Pretreatment of a membrane-permeable form of Ca2+ chelator BAPTA (BAPTA-AM) for 2h abolished Fura-2 response to ATP in HEK293T cells. GPN still induced small increases in the Fura-2 signal in the same cells (also see panel C). (C) ATP and GPN Fura-2 responses in HEK293T cells. (D) GPN (400 μM) induced increases of GCaMP3 fluorescence in HEK-GCaMP3-ML1 cells that were pre-treated and kept in continuous presence of BAPTA-AM, and the increases were abolished by Baf-A1 co-treatment. Note that ionomycin was still able to induce GCaMP3 increases. Panels D show the average response of 30–40 cells from one representative experiment. (E) Representative traces showing GCaMP3 sensitivities to patch-electrode-based 'puffing' of low-pH and high-Ca2+ solutions to GCaMP3-ML1-expressing vacuoles isolated from HEK-GCaMP3-ML1 cells.
Figure 1—figure supplement 4. Inhibition of PI(3,5)P2 production does not prevent lysosomal Ca2+ refilling.

Figure 1—figure supplement 4.

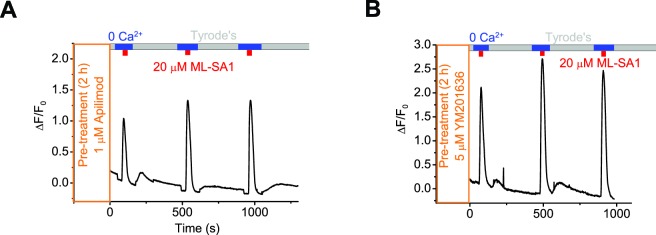
Representative Ca2+ imaging traces showing lysosomal Ca2+ refilling in GCaMP3-ML1 cells pretreated with Apilimod (A) or YM201636 (B). Panels A and B show the average response of 30–40 cells from one representative experiment.