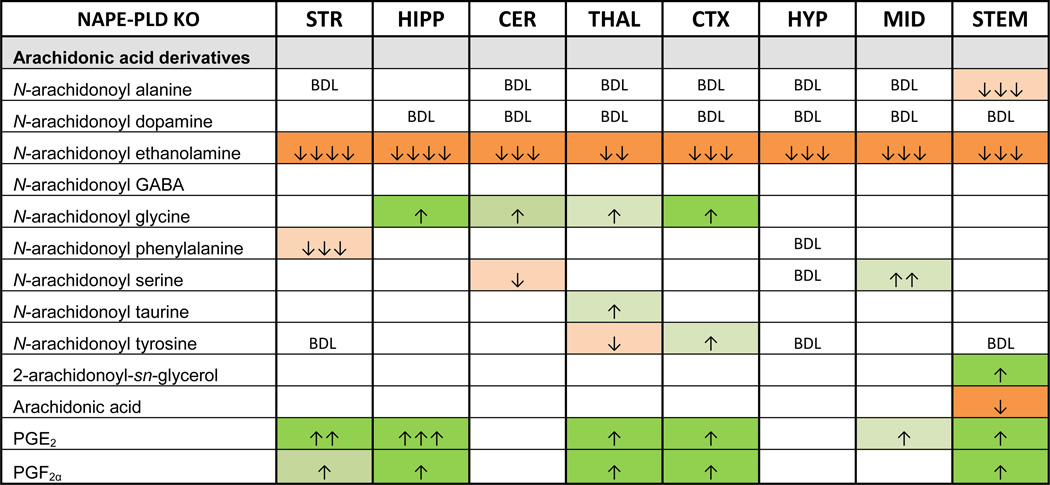
Table 3.
Summary of all arachidonic acid derived lipid species in the screen and their significance and magnitude of change in the Luquet line relative to WT controls.
Boxes in green indicate significant increases in the lipid and the number of arrows in the box indicates the magnitude difference (same scale as in Table 2). Likewise, orange boxes indicate a significant decrease. See supplemental tables for means and statistical analyses. Blank cells indicate no change between WT and NAPE-PLD KO, whereas BDL marks where lipids were present at concentrations below detection limits. See supplemental tables for means and statistical analyses.

