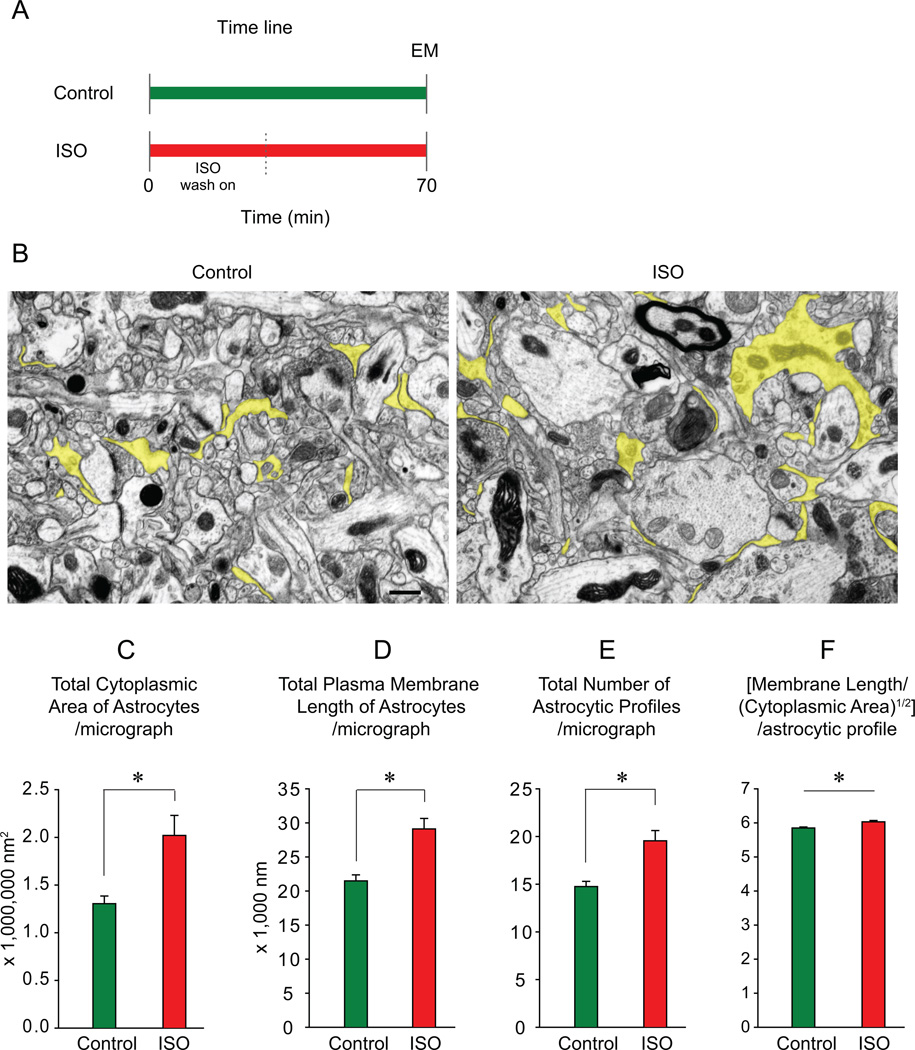
Figure 2.
Quantitative analysis of the morphology of astrocytic processes. A, Time line of EM experiment. B, Representative electron microscopic images of neuropil of the visual cortex under control and ISO conditions. Astrocytic profiles are colored in yellow. Scale bar: 500 nm. C–F, Summary of morphometric analyses (mean ± SEM); control: green, ISO: red; asterisk, significant.

