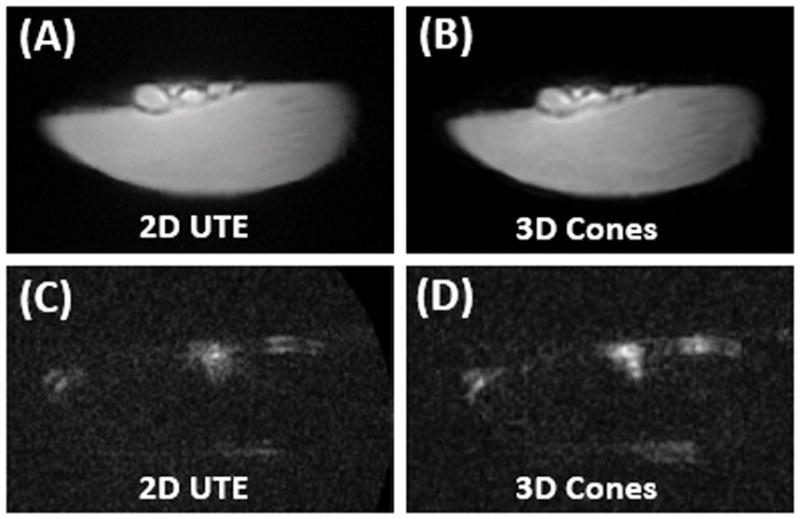
Figure 5.

Normal Achilles tendon imaged with 2D UTE (A) and 3D Cones (B) at 3T, as well as 2D UTE(C) and 3D Cones (D) imaging of the same tendon specimen after D2O exchange for one week. The normal tendon is visible before D2O exchange (A and B), but invisible after D2O exchange (C and D).
