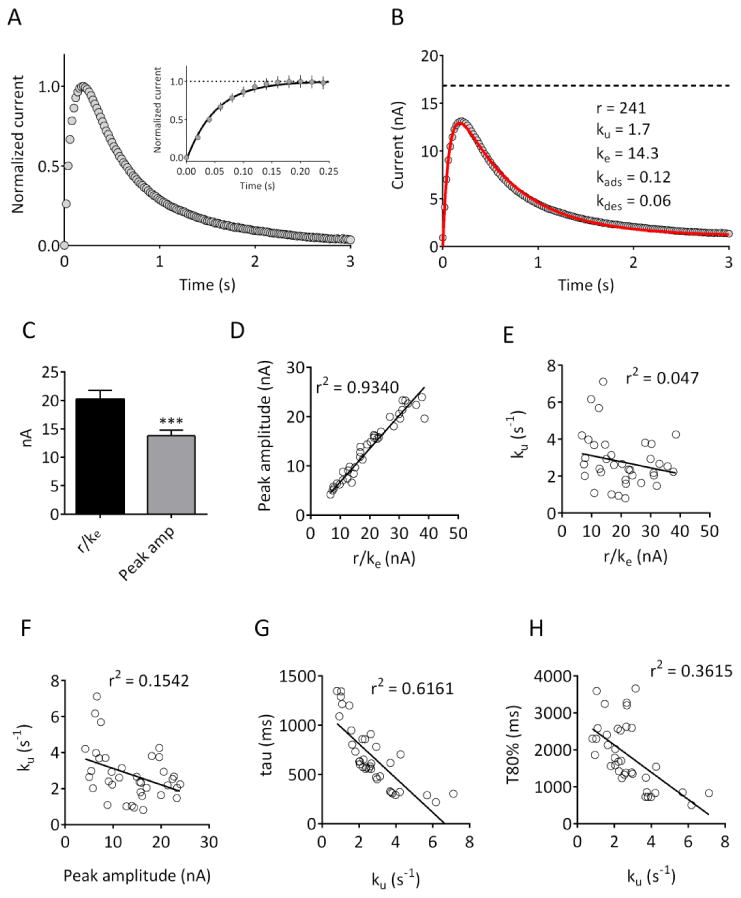
Figure 2. Fitting of the model to DA signals obtained in rat brain slices.

(A) Averaged current responses obtained in 37 brain slices obtained from 10 rats. Peak current was normalized for each slice. In this and subsequent figures, data are aligned so that time 0 corresponds to delivery of a single, 1 ms duration constant current pulse. The inset plot shows the initial rising phase of the current on an expanded time scale. Note that the increase in current was seen in the first data point sampled following stimulation (20 ms), and reached a plateau within 150-200 ms. (B) Raw data, from the same slices, fitted (solid red line) using the model described in the text. The parameters obtained are indicated; the dashed line represents r/ke. (C) Comparison of r/ke with peak amplitude values obtained in the same slices demonstrates that peak amplitude values are significantly lower than r/ke (n = 37; p <0.001, two-tailed paired t-test). (D)-(E) r/ke is strongly correlated with peak amplitude (p<0.0001) but is not correlated with the uptake parameter ku (p =0.1983). (F) Peak amplitude is significantly correlated with ku (p = 0.02). (G)-(H) Correlation of the uptake parameter ku with the decay time constant (tau; p <0.0001) and 80% decay time (T80%; p<0.0001) of the obtained signals.
