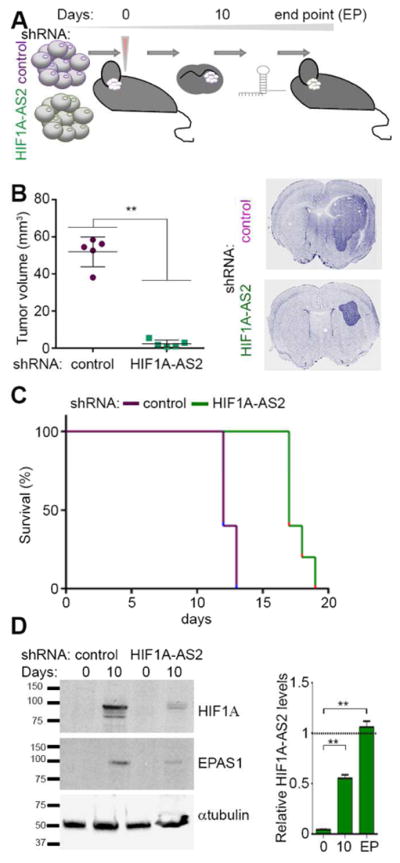
Figure 3. HIF1A-AS2 drives tumor progression in hypoxic environment.

(A) Workflow depicting in vivo experimental design.
(B) HIF1A-AS2 knockdown reduces tumor volume of mesenchymal GSC-originated intracranial xenografts. Quantification of tumor volume and representative DAPI staining of brain sections 10 days post implantation are shown. Data shown as mean ± SD, ** P value < 0.01.
(C) HIF1A-AS2 knockdown in mesenchymal GSC-originated tumors is associated with prolonged survival. Kaplan-Meier curves are shown. N = 5; P = 0.0023.
(D) Tumor microenvironment effect on HIF1A and EPAS1 expression depends on HIF1A-AS2 status. Representative Western blot (left) and qPCR (right) analyses are shown. Data shown as mean ± SD, ** P value < 0.01.
