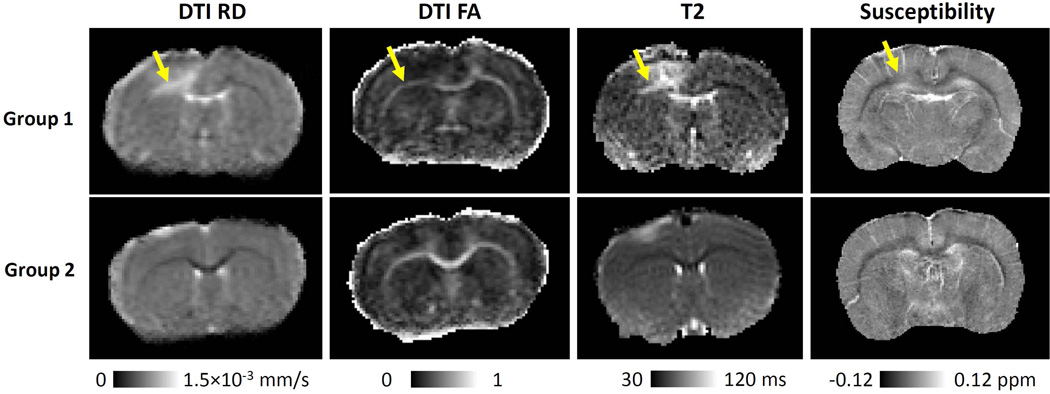
Figure 1.
The projection of white matter contrast along the corpus callosum. A: a representative projection for diffusion RD. The maximum RD value along the short blue lines was used as the RD value along the center of corpus callosum as outlined by the red line. The center of corpus callosum is labeled as the yellow dot. B: the profile of RD along corpus callosum based on the distance from the center of the corpus callosum in mm. Red solid lines: group 1 (n=6). Gray solid lines: Group 2 (n=12).

