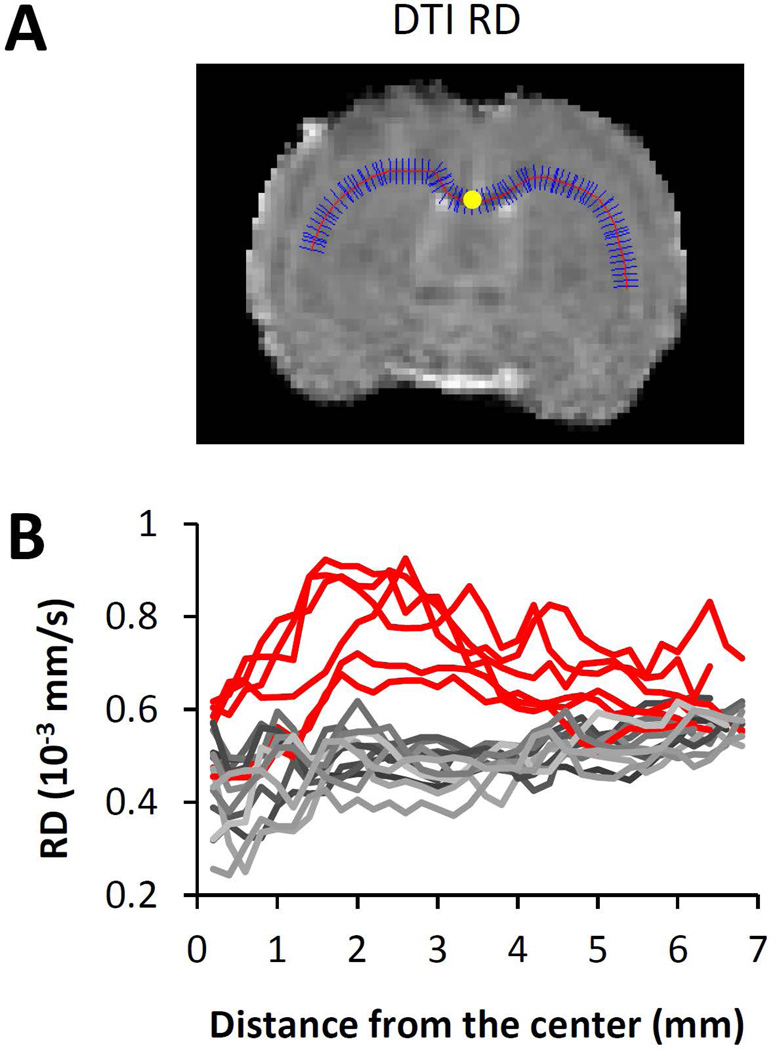
Figure 2.
Representative diffusion, T2 and susceptibility images of the TBI rats for group 1 (n=6, upper row) and group 2 (n=12, lower row). The white arrow pointed to the increased RD, T2, decreased FA and increased magnetic susceptibility. The yellow arrow pointed out the white matter abnormalities in group 1.

