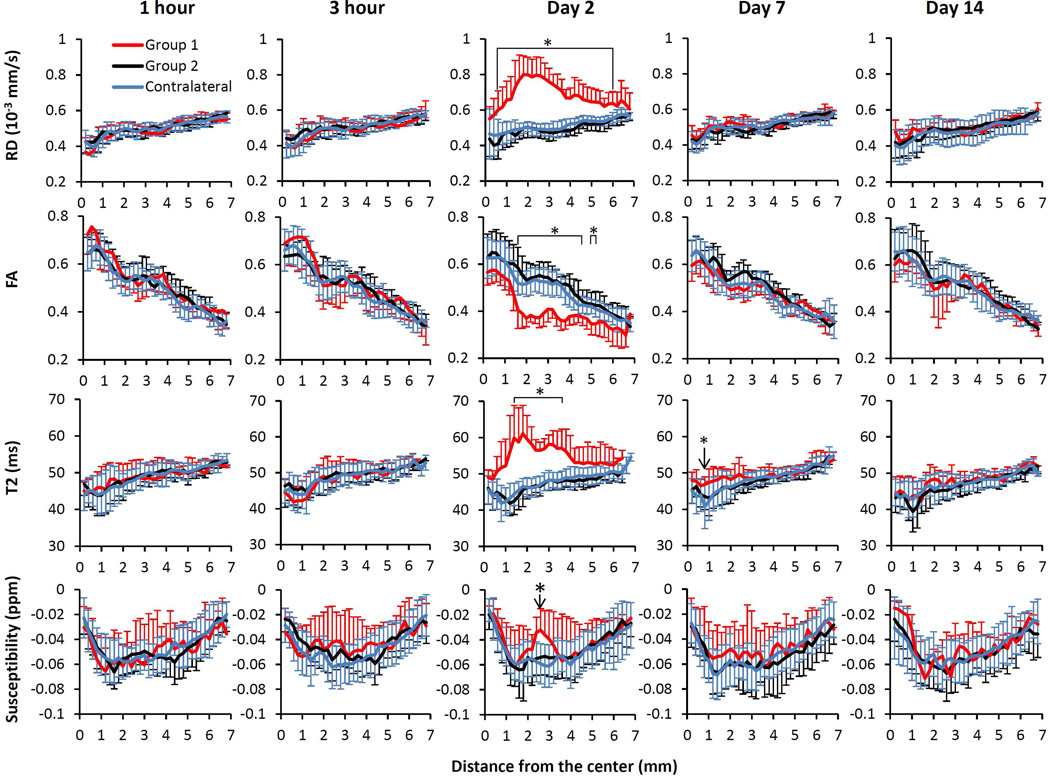
Figure 3.
Spatiotemporal changes in RD, FA, T2 and susceptibility values at 1 hour, 3 hours, 2 days, 7 days and 14 days based on the distance from the center of the corpus callosum in mm.. *p<0.05 between group 1 (n=6) and group 2 (n=12) ipsilesional values, and between group 1 ipsilesional and contralateral hemispheres.

