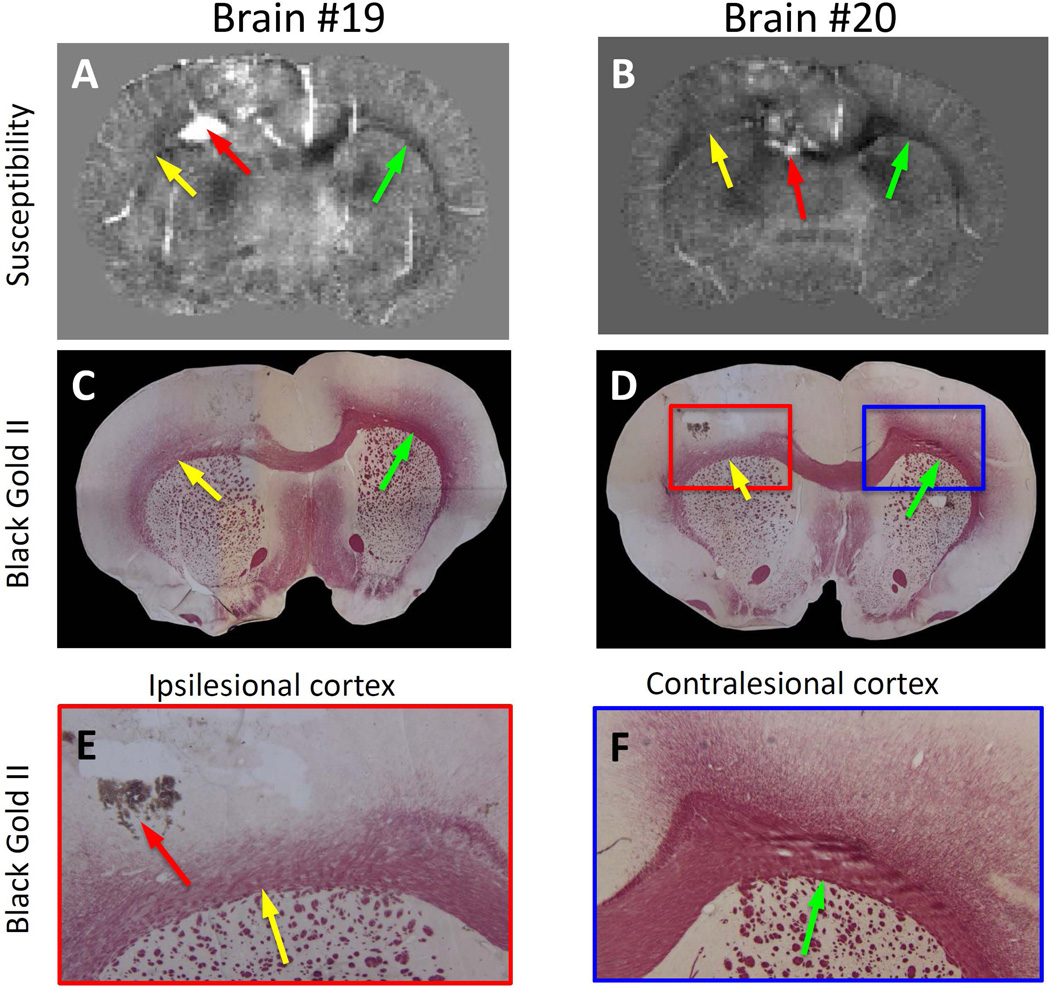
Figure 5.
Comparison of magnetic susceptibility with white matter histology. A and B: magnetic susceptibility for two different rat brains. C and D: myelin staining using Black Gold II of the same rat brains as A and B. E and F: Zoom in images of the ipsilesional and contralesional images of the histology shown in D. Yellow arrow: ipsilesional. Green arrow: contralesional. The red arrow pointed to hemorrhages resulted from the controlled cortical impact.

