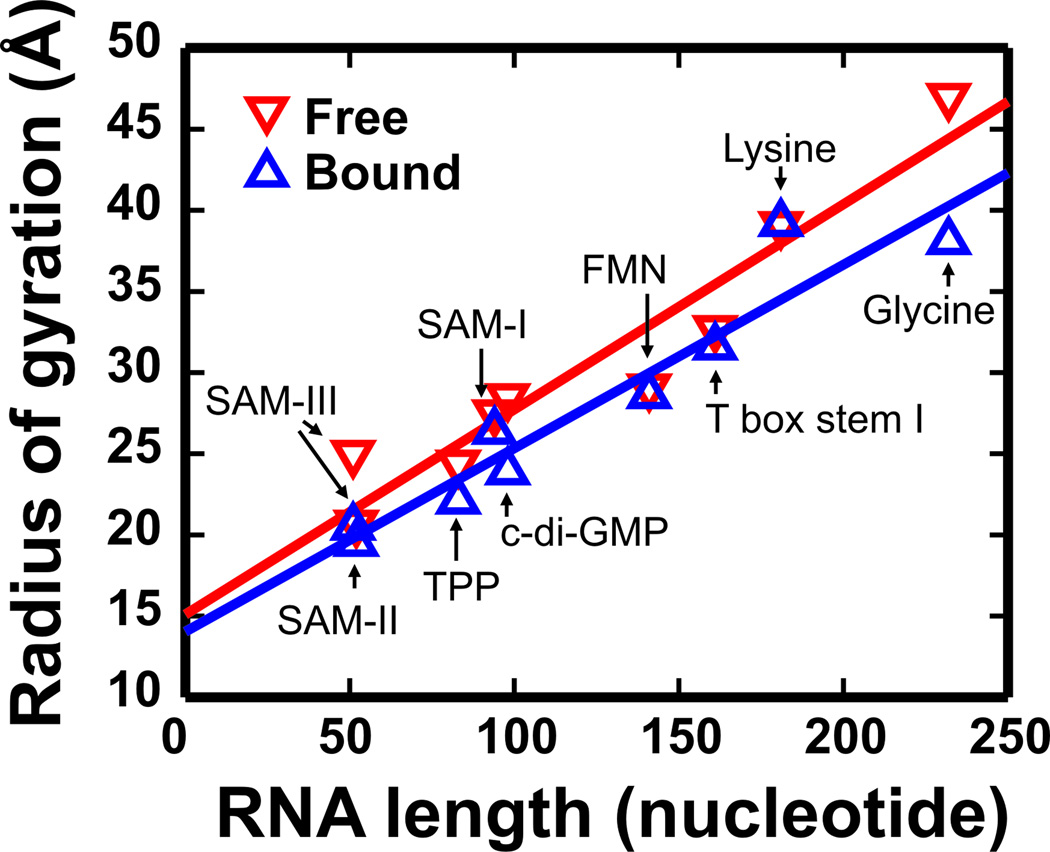
Figure 3.
SAXS analysis of Riboswitches. The radius of gyration (Rg) of free (red) and ligand-bound riboswitches (blue) is plotted as a function of RNA length. In all samples, Mg2+ is present. A linear least square fit to these two data sets shows a nearly monotonic relationship between the size and length of the riboswitches. The two separated straight lines also show that the ligand-bound riboswitches are in general more compact than the free riboswitches. The Rgs of T box stem I was measured in our lab and reported in Ref. (60). The Rgs of other riboswitches are from Table 1 in Ref. (40).

