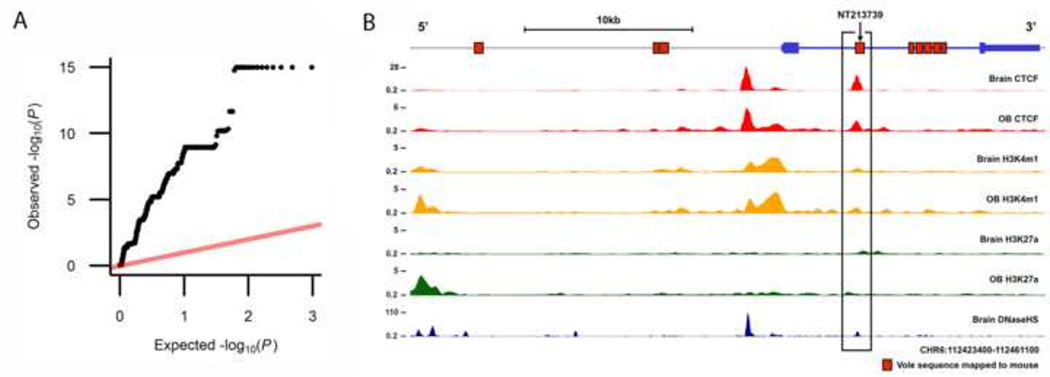
Figure 3.
Identification of NT213739 as a marker of NAcc OXTR density. (a) Quantile-quantile plot of the associations between the 967 Oxtr markers and NAcc OXTR density. Each dot represents the –log P of the association between a particular SNP with OXTR density placed in ascending order. (b) A schematic of the mouse Oxtr gene with accompanying functional data from the ENCODE project. The prairie vole sequences containing the SNPs showing the strongest association with NAcc OXTR density that also map to mouse Oxtr sequence. Approximately 500 bp per SNP of prairie vole sequence surrounding each SNP was aligned to the mouse genome as indicated by red rectangles in the figure. ChIP-seq signal or DNaseHS signal is shown. OB, olfactory bulb; Brain, whole brain; CTCF, CCCTC-binding factor (red) ; H3K4m1, a single methyl modification of lysine 4 of the H3 histone (orange); H3K27a, acetylation modification of lysine 27 on the H3 histone (green); DNaseHS, deoxyribonuclease I hypersensitive sites (dark blue).

