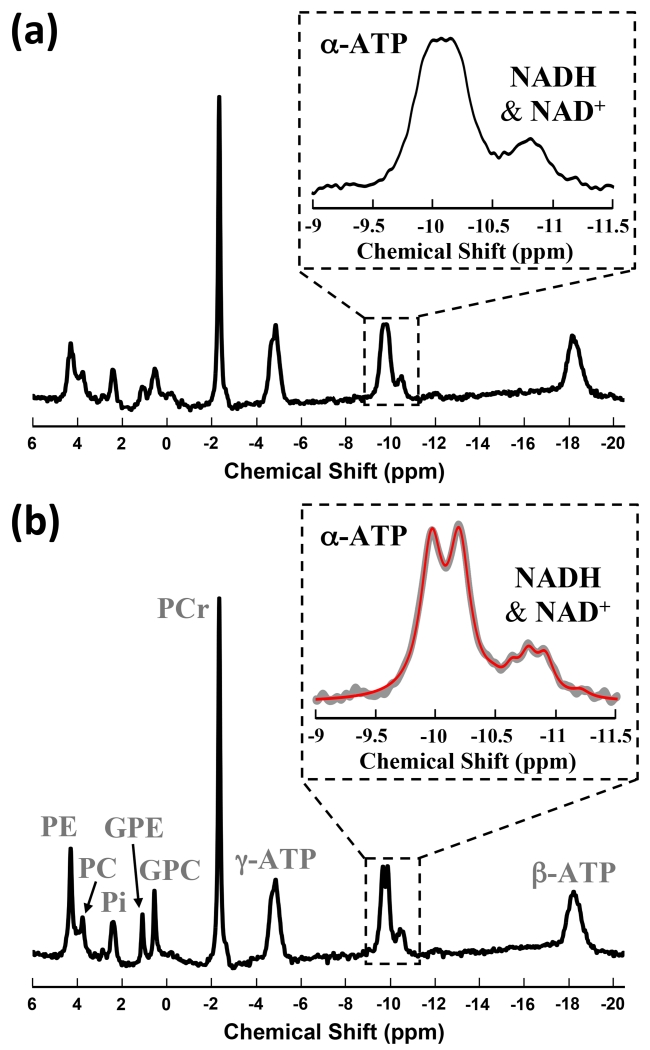
Figure 1.
1H-coupled (a) and 1H-decoupled (b) in vivo 31P MR spectra of human visual cortex from a representative subject (320 scans). Inserts are the expanded spectra in the chemical shift range of −9 to −11.5 ppm. In the insert of (b), original signals (gray trace) and model fitted total signals of α-ATP and NADs (red trace) are displayed.

