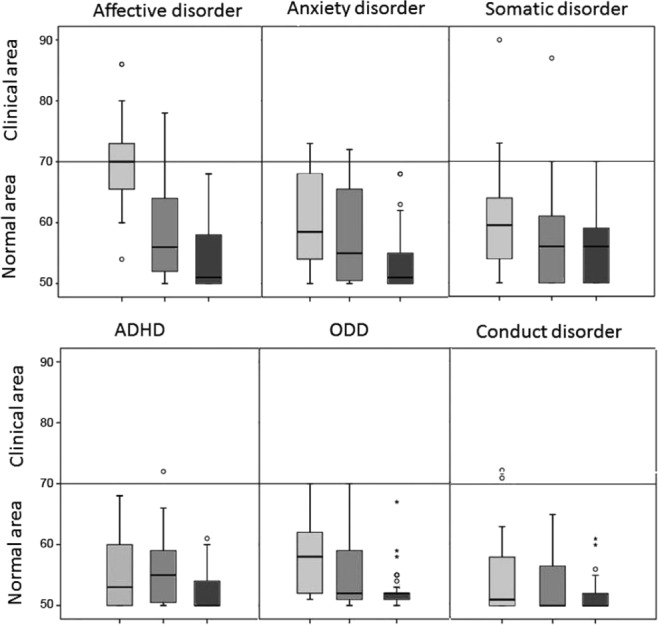
Figure 2.

Distribution of T-scores in Diagnostic and Statistical Manual Oriented scales. Distribution of T-scores for NT1 (gray box), IE patients (dark gray box), and controls (black box) in Diagnostic and Statistical Manual Oriented scales. In the box plot graph, box's sides mark the first and third quartiles, the central line represents the median and the whiskers account for the maximum and minimum; outliers points lie outside the fences. The horizontal lines mark clinical/normal boundaries. ADHD, attention deficit/hyperactivity disorder; CBCL, Child Behavior Checklist; IE, idiopathic epilepsies; NT1, narcolepsy type 1; ODD, oppositional/defiant disorder.
