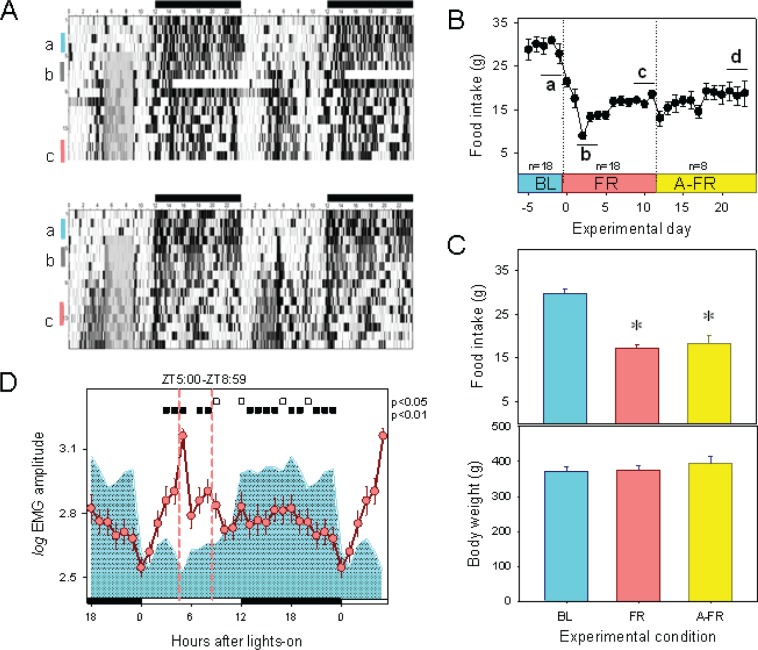
Figure 1.
EMG, food intake, and body weight during BL, FR, and A-FR protocols. (A) Double plots of EMG activity obtained in two representative animals recorded before and during scheduled food restriction The four-hour FR protocol started at ZT 5 (gray area on raster plot), after a BL period of ad libitum food intake. Light-dark cycle indicated at upper abscissa. Vertical bars on left ordinate indicate selected 48-h interval when polysomnographic samples were obtained under BL (a), initial FR (b), and late FR (c) conditions. (B) Average (± SEM) food intake across experimental protocol. Intervals identified as a, b, c, and d correspond to experimental days when polysomnographic recordings were obtained under BL, initial FR, late FR, and advanced-FR (A-FR) conditions, respectively (see Results). (C) Average (± SEM) food intake and body weight under BL, late FR, and A-FR conditions. * = significant differences vs. BL (P < 0.001, post hoc Bonferroni multiple comparison test after one-way ANOVA). (D) Mean curve of EMG amplitude under BL (cyan area) and FR (reddish circles). Values correspond to the hourly mean of (log) EMG amplitude (± SEM) obtained for 18 animals after at least 9 days of FR (segment c in rasterplot). Filled and open squares under upper abscissa indicate significant differences vs. baseline (2-tailed paired t-test after significant 2-way rmANOVA).

