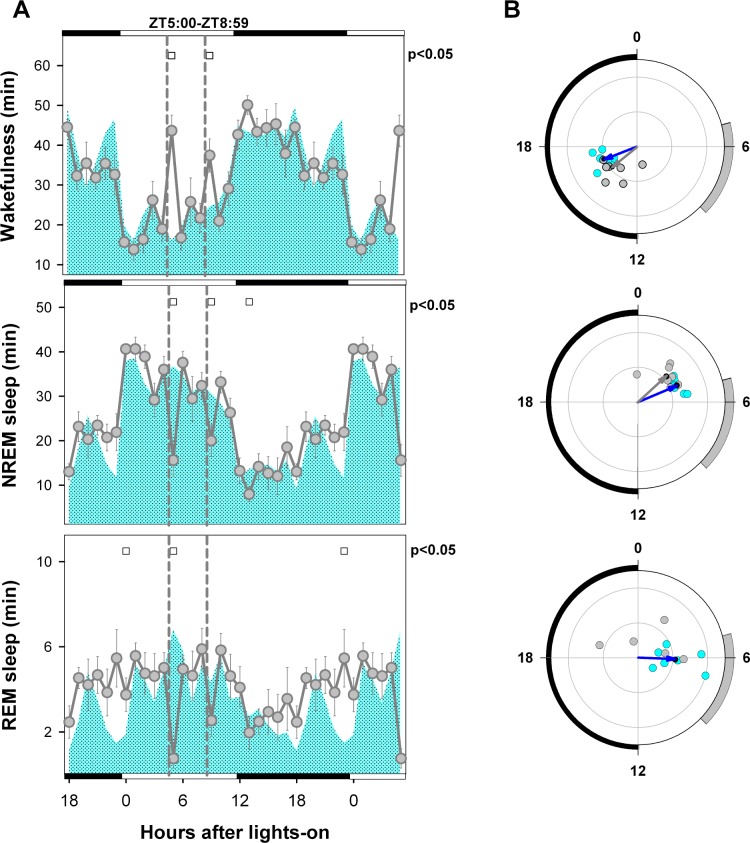
Figure 2.
Mean curve and circular statistics of sleep-wake states under BL and initial FR conditions. (A) Mean curves for baseline (cyan area) and initial FR (gray circles, ± SEM) conditions obtained for 7 animals. Open squares under upper abscissa indicate significant differences vs. baseline (2-tailed paired t-test after significant 2-way rmANOVA). The initial and final 6 h of the light-dark cycle are double-plotted. Photoperiod indicated on the abscissa and vertical dashed lines delimits the food availability window (ZT 5:00–ZT 8:59). (B) Blue and gray arrows correspond to BL and FR mean vectors, respectively (Hotelling second-order analysis of angles). Cyan (BL) and gray (FR) dots correspond to averaged individual acrophases for the corresponding vector. Note that the REM sleep FR vector is not significant. Radial ordinate corresponds to the magnitude (r) of the mean vector (total radius = 0.5). Zeitgeber time is indicated on the circular abscissa. The black semicircle delimits the dark phase, and the gray arc indicates the feeding interval under the food restriction condition.

