
Figure 4.
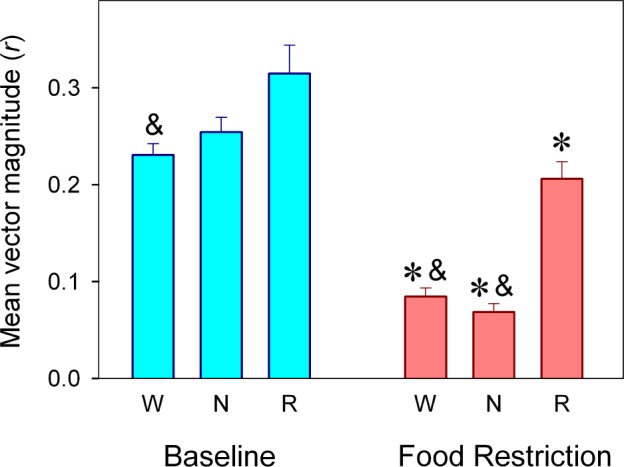
Magnitude (r) of mean vector for the sleep-wake cycle states under BL and food entrainment. Values correspond to averages r values (± SEM) obtained for wakefulness (W, n = 16 rats), NREM sleep (N, n = 16 rats), and REM sleep (R, n = 17 rats). * = P < 0.05 between conditions, according to post hoc paired t-test after significant rmANOVA; & = significant differences vs. REM sleep within condition, according to Holm-Bonferroni-corrected paired t-test. See text for statistical details.