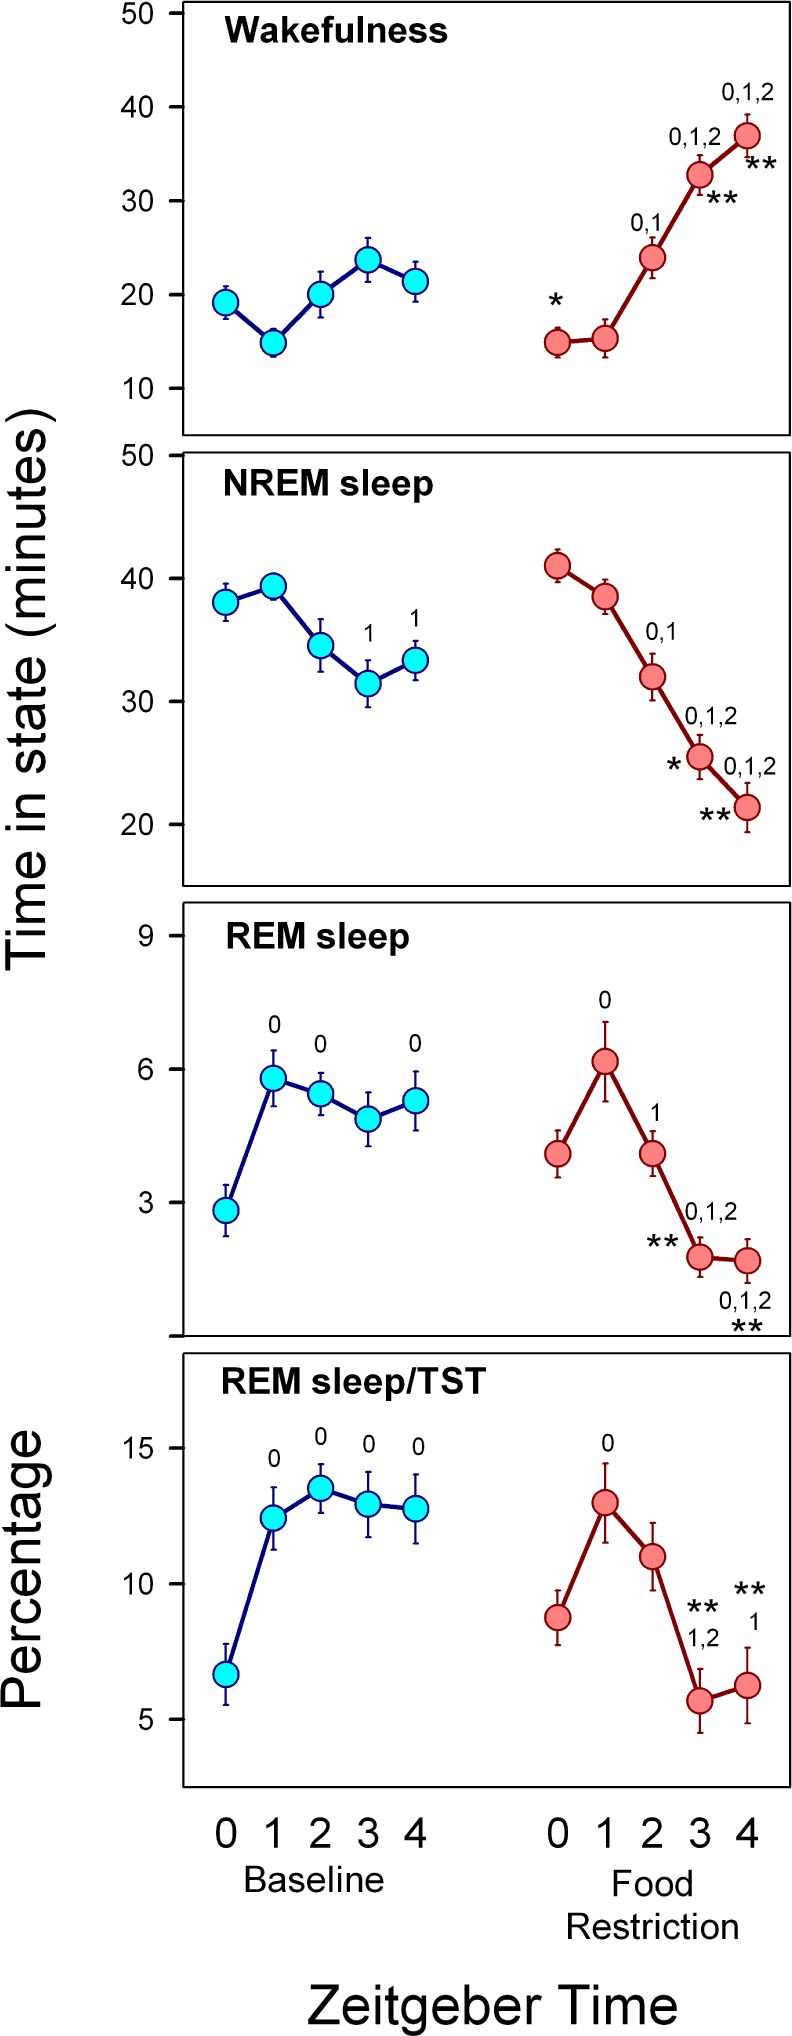
Figure 5.

Sleep-wake states during food anticipation interval. Hourly averages (± SEM, n = 18 rats) of time in each state and REM/TST ratio during the ZT 0–ZT 4 interval under baseline (cyan symbols) and food restriction (reddish symbols) conditions. Numbers associated with the curves identify the zeitgeber time vs. which current value exhibits significant differences within the experimental condition (post hoc paired t-test indicating a significant difference according to Holm-Bonferroni correction, after significant rmANOVA). * = P < 0.01 paired t-test between conditions at the corresponding zeitgeber time.
