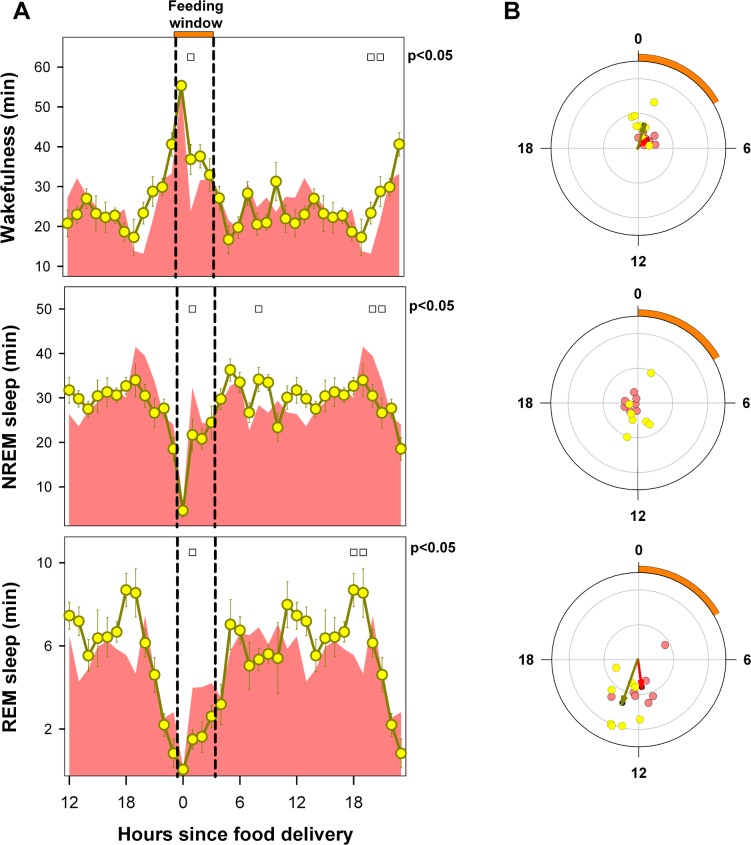
Figure 8.
Mean curves of sleep-wake states under FR (reddish area) and A-FR (yellow circles) conditions. Values correspond to the hourly mean time of the state (± SEM) obtained for 8 animals that completed at least 9 days of the FR and A-FR protocols. (A) Data are aligned according to feeding time (orange horizontal bar at upper abscissa and vertical dashed lines). Open squares under upper abscissa indicate significant differences between protocols (P < 0.05, 2-tailed paired t-test after significant 2-way rmANOVA). (B) Red and yellow arrows correspond to FR and A-FR mean vectors. Reddish (FR) and yellow (AFR) dots correspond to individual acrophases averaged for the corresponding vector. Note that the NREM sleep vector under A-FR is not significant. Radial ordinate corresponds to the magnitude (r) of mean vector (total radius = 0.5). Orange arc indicates the feeding interval starting at feeding time 0.

