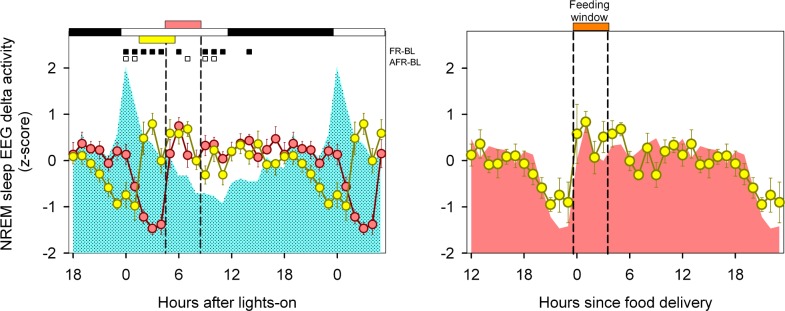
Figure 9.
Normalized NREM sleep EEG delta activity. (A) Mean curves of normalized NREM sleep delta activity under BL (cyan area), FR (reddish circles), and A-FR (yellow circles), aligned according to photic zeitgeber time. Data correspond to hourly values (± SEM) obtained in 8 animals that completed at least 9 days of the FR and A-FR protocols. Significant differences vs. BL are indicated by squares under upper abscissa (P < 0.05, Holm-Bonferroni-corrected 2-tailed paired t-test after significant 2-way rmANOVA). Horizontal white and black bars indicate photoperiodic conditions. Reddish and yellow horizontal bars indicate the feeding window under FR and A-FR, respectively. (B) Mean curves for FR (reddish area) and A-FR, aligned according to feeding time (orange horizontal bar).

