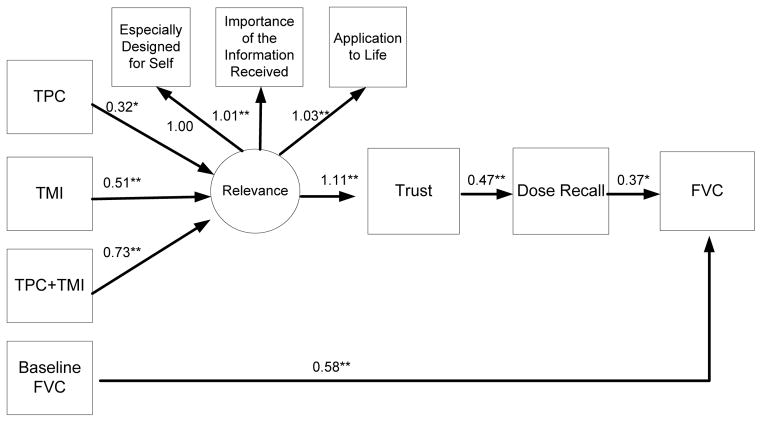
Figure 3.
Path diagram of model testing information processes as mediators of the association between intervention and fruit and vegetable consumption, adjusting for baseline fruit and vegetable consumption. Unstandardized β weights for variables entered into the model are shown. Significant relationships are indicated by asterisks (*p < .05, **p < .001).

