Fig. 1.

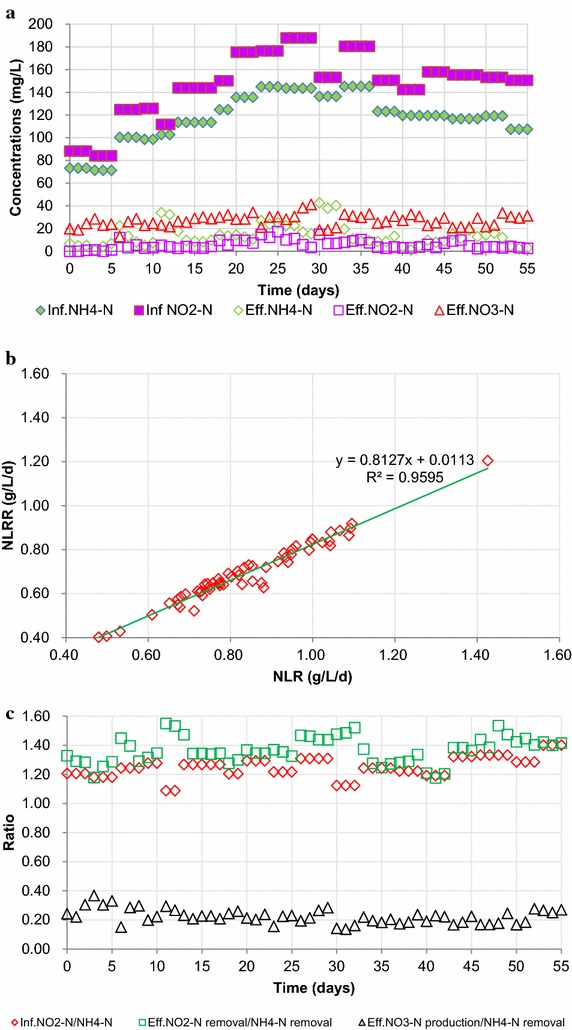
Reactor performance during the study. a Changes in nitrogen concentrations; b changes in NLR and NLRR; c ratios of inf. NO2-N/NH4-N, eff. NO2-N removal/NH4-N removal, and eff. NO3-N production/NH4-N removal. Inf. influent, Eff. effluent

Reactor performance during the study. a Changes in nitrogen concentrations; b changes in NLR and NLRR; c ratios of inf. NO2-N/NH4-N, eff. NO2-N removal/NH4-N removal, and eff. NO3-N production/NH4-N removal. Inf. influent, Eff. effluent