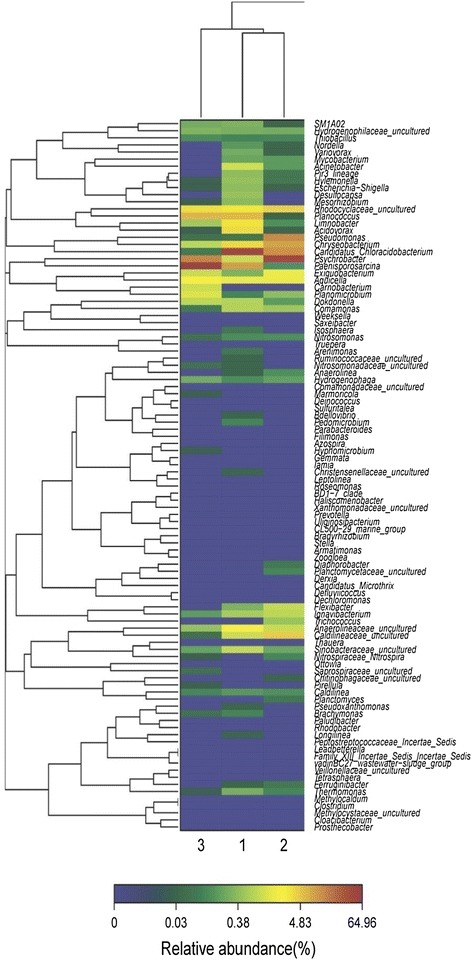
Fig. 4.

Hierarchical cluster analysis of 1, 2 and 3 bacterial communities. 1, N2O emission 0.6 %, nitrogen removal rate 0.4 kg-N m-3 day−1; 2, day 36, N2O emission 0.7 %, nitrogen removal rate 0.73 kg-N m−3 day−1; 3 day 50, N2O emission 0.18 %, nitrogen removal rate 3 kg-N m-3 day−1. The y-axis is the clustering of the 100 most abundant OTUs (3 % distance) in reads. The OTUs were ordered by genus. Sample communities were clustered based on complete linkage method. The color intensity of scale indicates relative abundance of each OUT read. Relative abundance was defined as the number of sequences affiliated with that OTU divided by the total number of sequences per sample
