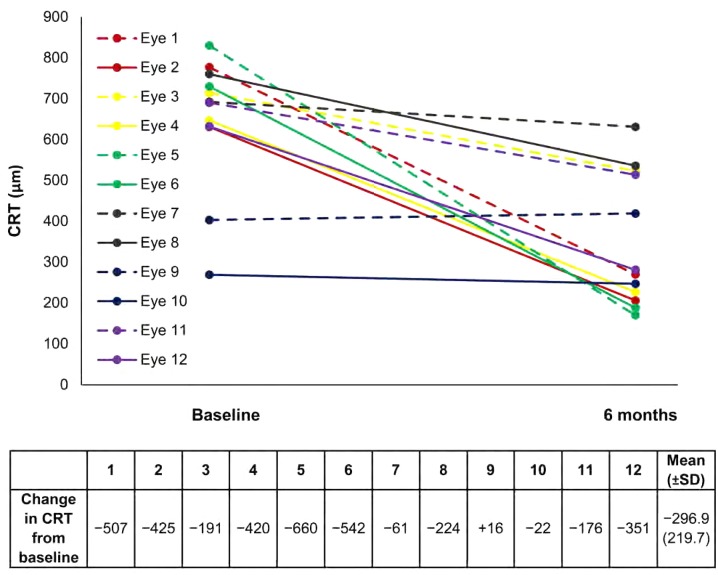
Fig. 2.
Changes in CRT before and 6 months after 0.2 μg/day FAc implant. Baseline CRT (μm) and CRT 6 months post-0.2 μg/day FAc implant are shown for each eye. Eyes from the same patient are shown in the same color, one with a solid line and the fellow eye with a dotted line (patient 1 red; patient 2 yellow; patient 3 green; patient 4 gray; patient 5 blue; patient 6 purple). The change from baseline is presented numerically for each eye, and overall (mean ± SD) in tabular format below the graph. CRT central retinal thickness, FAc fluocinolone acetonide, SD standard deviation

