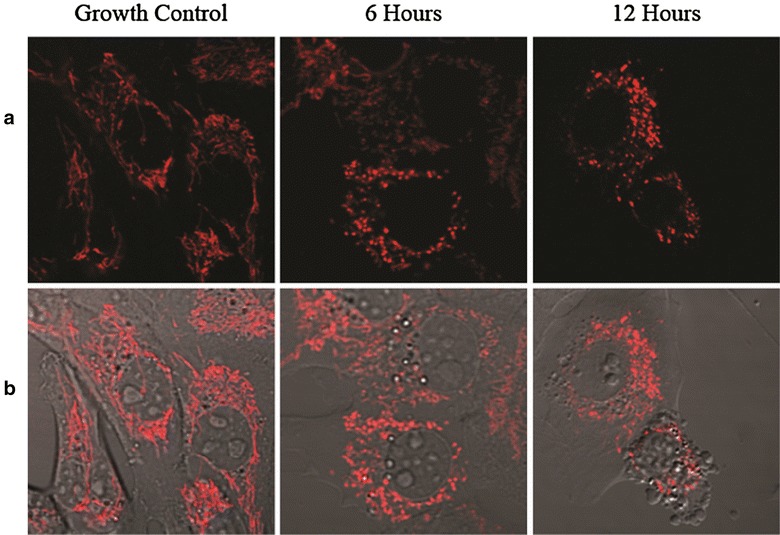
Fig. 7.

Changes in mitochondrial morphology after pterocellin A treatment at 1000 ng/mL after 6 and 12 h. a Mitochondria stained with 50 nM MitoTracker Red CMXRos (Em. 599 nm). b Overlay of stained mitochondria and phase contrast images
Photos obtained from the Olympus FV1000 laser scanning confocal microscope at ×400 magnification
