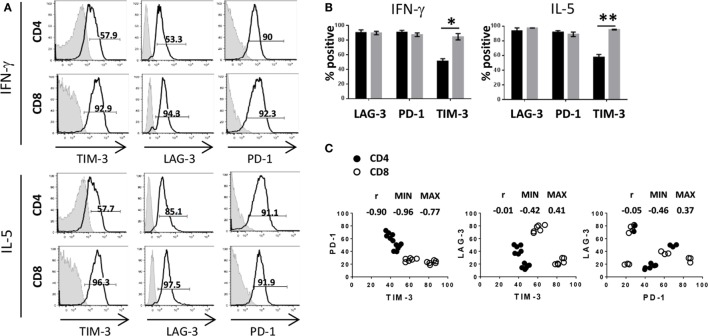
Figure 3.
Differential expression of immune checkpoints between CD4+ and CD8+ T cells. Human pan T cells were stimulated with allogeneic DC for 6 days, as done in Figure 2, and analyzed for intracellular cytokines as done in Figure 1. (A) Gates were drawn on IFN-γ or IL-5-positive CD4+ and CD8+ T cells and expression of TIM-3, LAG-3, and PD-1 (black lines) is shown compared to isotype control (shaded gray) as percent positive events. (B) Graphical representation LAG-3, PD-1, and TIM-3 expression levels on IFN-γ and IL-5 producing CD4+ (black) and CD8+ (gray) T cells. Data are mean ± SEM compiled from three donors. *p < 0.005, **p < 0.001, two-tailed t-test (Holm–Sidak). (C) Expression of PD-1, LAG-3, and TIM-3 was analyzed on activated CD4+ (closed circles) or CD8+ (open circles) T cells. TIM-3 expression was compared to PD-1 (left panel), LAG-3 (center panel), and PD-1 expression was compared to LAG-3 (right panel). Spearman’s rank correlation coefficients r, along with 95% confidence intervals (MIN and MAX), are shown. Data compiled from four different donors conducted in three independent experiments.

