Figure 4.
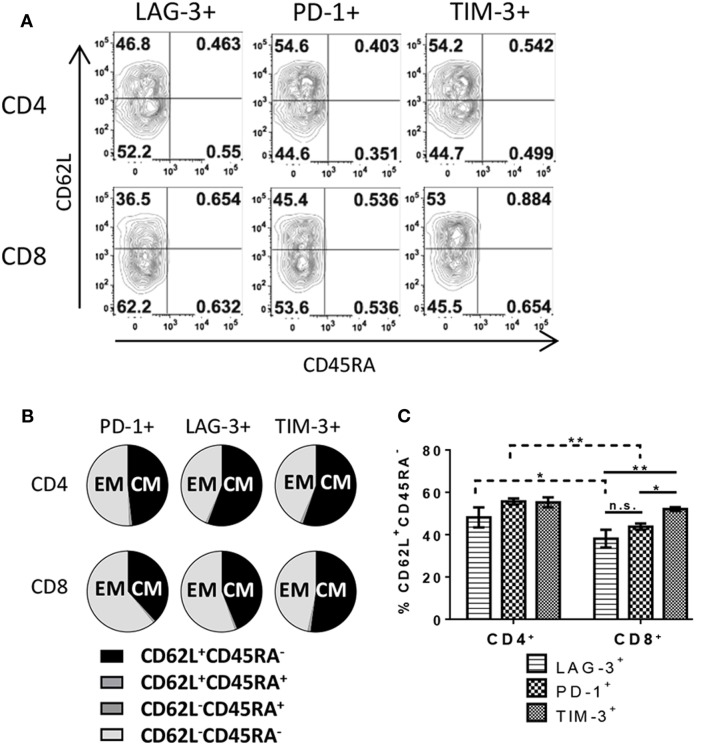
T cells expressing immune checkpoint molecules exhibit central and effector memory phenotypes. Human pan T cells were stimulated with allogeneic DC for 6 days, as done in Figure 2. LAG-3, PD-1, and TIM-3 expressing CD4+ and CD8+ T cells were subsequently analyzed for CD45RA and CD62L expression. (A) Representative flow cytometric contour plots, gated on dividing CD4+ or CD8+ T cells, depicting quadrant gates separating different T cell memory subsets. (B) Pie charts quantifying T cell memory subsets within each immune checkpoint molecule expressing population. (C) Bar graph comparing frequencies of CD62L+ CD45RA− cells within each immune checkpoint molecule expressing population. Data are mean ± SEM compiled from three donors. *p < 0.05, **p < 0.01, two-way ANOVA (Dunnet’s).

