Figure 1.

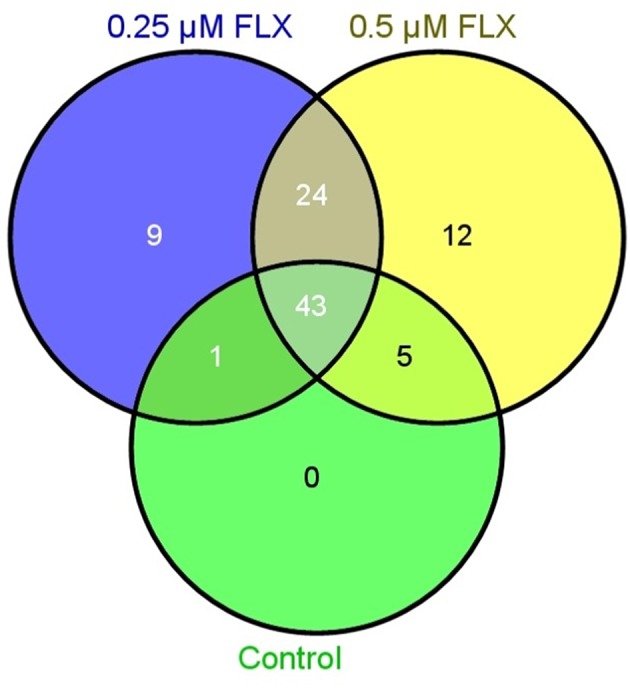
Venn diagram illustrating the number of proteins detected by mass spectrometry in embryos treated with 0.25 μM fluoxetine (FLX), 0.5 μM fluoxetine and controls.

Venn diagram illustrating the number of proteins detected by mass spectrometry in embryos treated with 0.25 μM fluoxetine (FLX), 0.5 μM fluoxetine and controls.