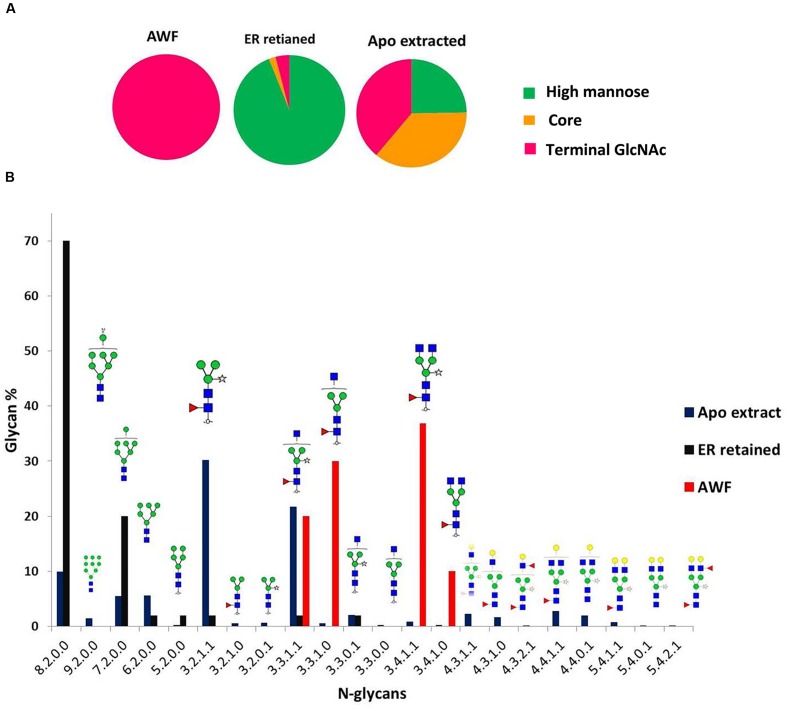
FIGURE 6.
N-glycan distribution analysis of different prBChE species. (A) Categories of N-glycans for each prBChE species are represented as pie charts. (B) Distribution of N-glycans of different prBChE species [prBChE-ER (ER), prBChE-AWF (AWF) and prBChE (Apo)] is shown on y-axis, while x-axis represents nomenclature of N-glycans as (Hex/HexNAc/Fucose/xylose).

