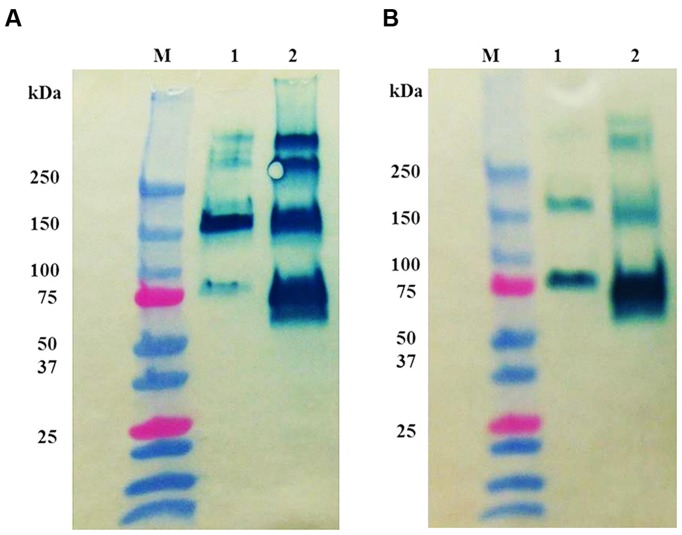
FIGURE 8.
Oligomer distribution analysis by Western blot using (A) non-reducing and (B) reducing conditions SDS-PAGE analysis. Western blot analysis was developed using 1:200 mouse anti-BChE antibody and 1:2,000 goat anti-mouse HRP conjugated antibody of 0.25 μg of equine BuChE control (lane 1) and 0.25 μg pure prBChE protein (lane 2). Lane M shows the pre-stained protein molecular weight standards along with the molecular weight in kDa.

