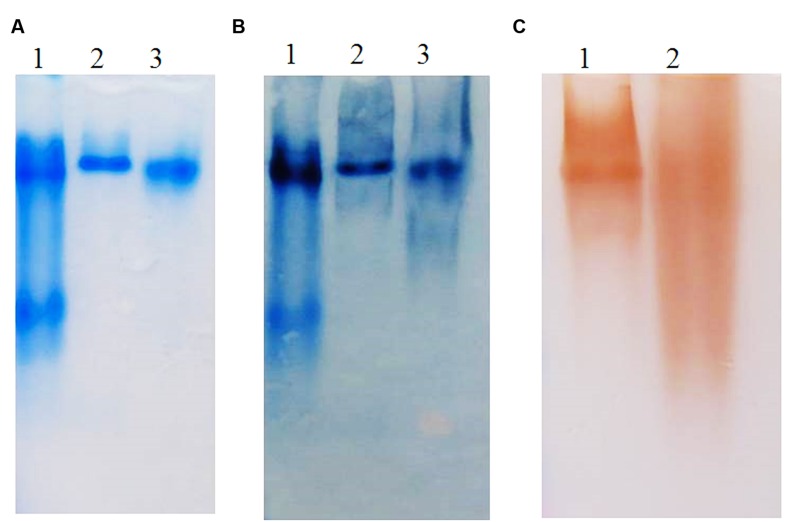
FIGURE 9.
(A) Coomassie stained, (B) Western blot, and (C) activity stained Native gel analysis of prBChE, compared to BChE control. (A,B) Coomassie stained and Western blot 7.5% gel with 3 μg of purified prBChE (lane 3) compared to BChE mammalian serum enzymes (1.5 μg of human protein: lane 1, 3 μg equine protein: lane 2). (C) Activity stained of 0.25 mU pure prBChE (lane 2) and 0.25 mU equine control (lane 1).

