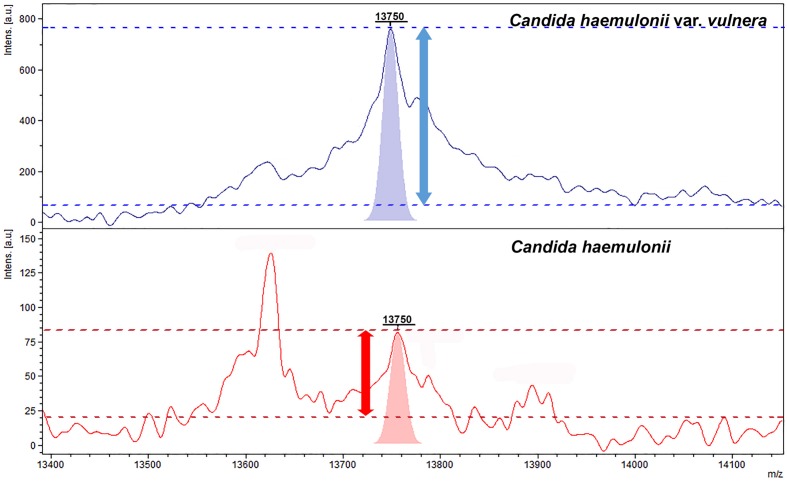
FIGURE 3.
Representative mass spectra of C. haemulonii sensu stricto (red) and C. haemulonii var. vulnera (purple) between 13400 and 14100 Da showing the peak intensities and peak areas of the 13750 Da peak. Horizontal dashed lines depict the signal (above) and noise (below) intensity values used to calculate the signal-to-noise ratios.

