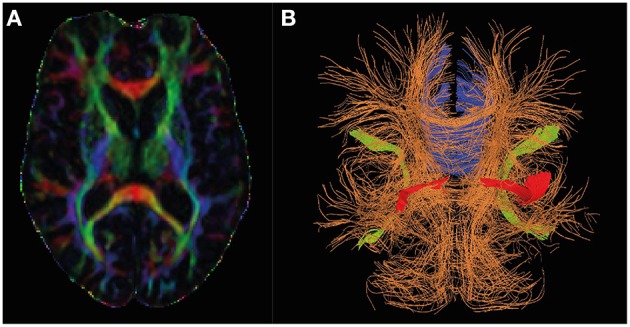
Figure 1.

Diffusion tensor MRI in Alzheimer's research. Panel (A) shows the directional information encoded by diffusion tensor imaging by color (red: left-right, green: anterior-posterior, blue: head-foot) and fractional anisotropy (high intensity implies high fractional anisotropy). Panel (B) shows how the directional information may be represented in a deterministic tractography analysis, and shows the regions consistently identified and changing in AD (Blue: Corpus callosum, red: uncinate fasciculus, green: superior lateral fasciculus).
