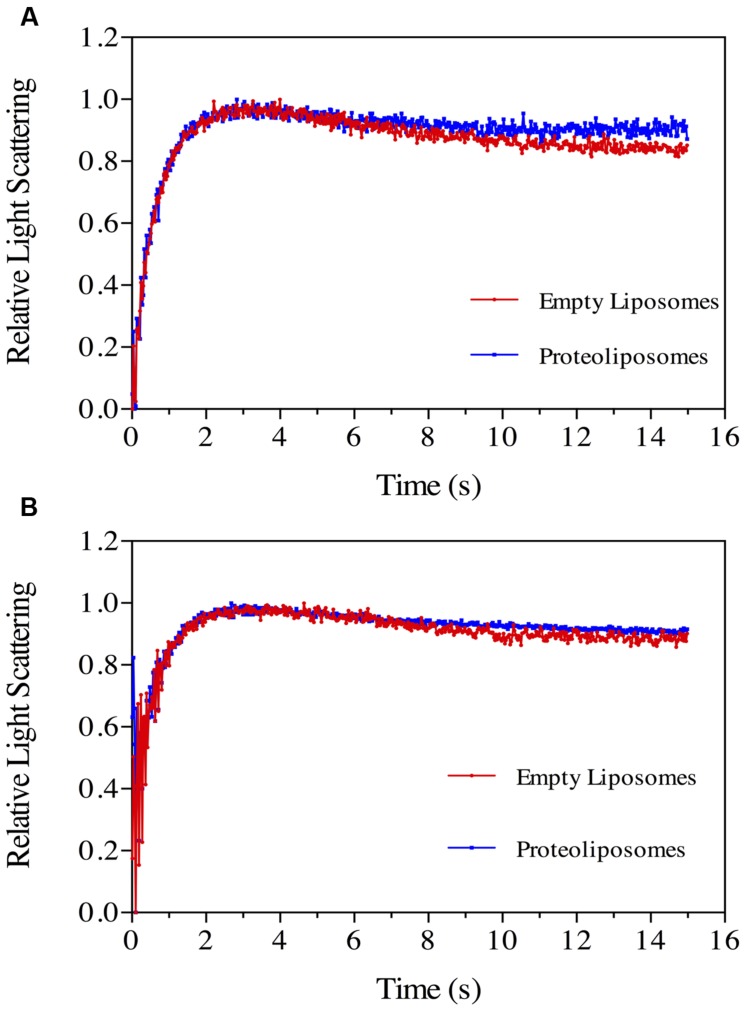
FIGURE 7.
Boric acid permeability in proteoliposomes. Stopped-flow traces showing kinetics of boric acid transport in phosphorylated (A) and dephosphorylated (B) NbXIP1;1α protein reconstituted in E. coli lipid vesicles supplemented with 20% cholesterol. Control liposomes (red) and proteoliposomes (blue). (A) The traces (mean of eight traces) were fitted to double exponential equations. The rate constant and SEE values for the fitted curves were control (R1 = 1.47 ± 0.03 s–1; R2 = 0.11 ± 0.01 s–1) and NbXIP1;1α (R1 = 1.62 ± 0.05 s–1; R2 = 0.20 ± 0.03 s–1). (B) The rate constant and SEE values for the fitted curves after fitting the traces (mean of 15 and 29 traces for control liposomes and proteoliposomes, respectively) to double exponential equations were control (R1 = 1.44 ± 0.07 s–1; R2 = 0.11 ± 0.04 s–1) and NbXIP1;1α (R1 = 1.02 ± 0.10 s–1; R2 = 0.26 ± 0.07 s–1).

