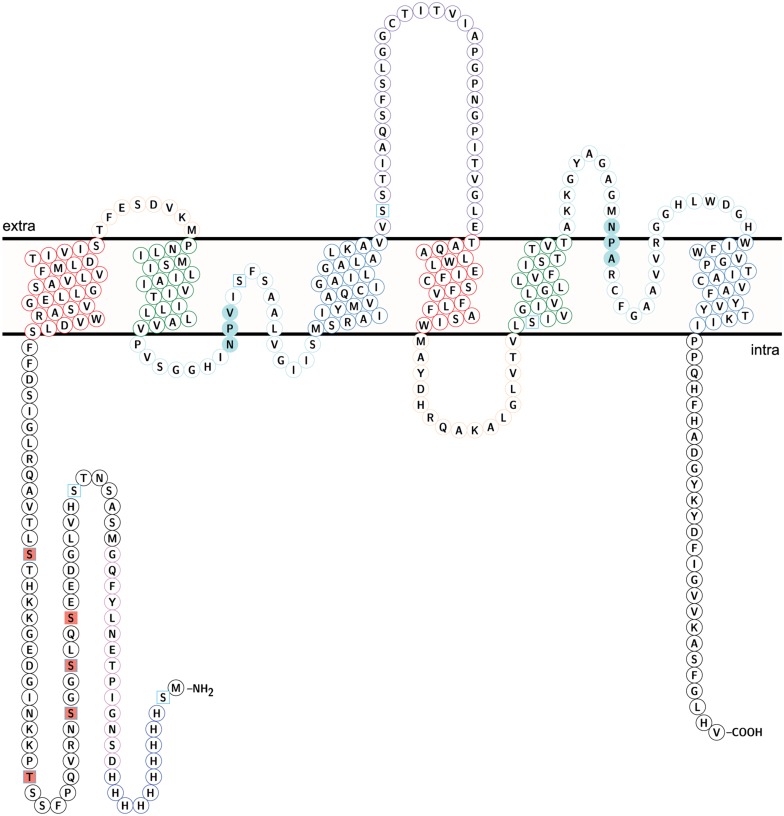
FIGURE 8.
Topology of NbXIP1;1α protein showing identified phosphorylation sites. Identified phospho sites – square salmon fill. Predicted phospho sites – square frame in sky blue. The coloring of helices and loops reflect a direct repeat in the gene/protein. Transmembrane helix (TM) 1 and TM 4 – frame in red. TM2 and TM 5 – frame in green. TM 3 and TM 6 – frame in steel blue. Loop A and Loop D – frame in peach. Loop B and loop E – frame in pale turquoise. Loop C – frame in medium purple. NPV/NPA box – pale turquoise fill. H3-H12 – Histidine tag in blue. D13-G26 – TEV protease cleavage site and linker in violet. The topology model was done in Protter (Omasits et al., 2014).

