Figure 4.

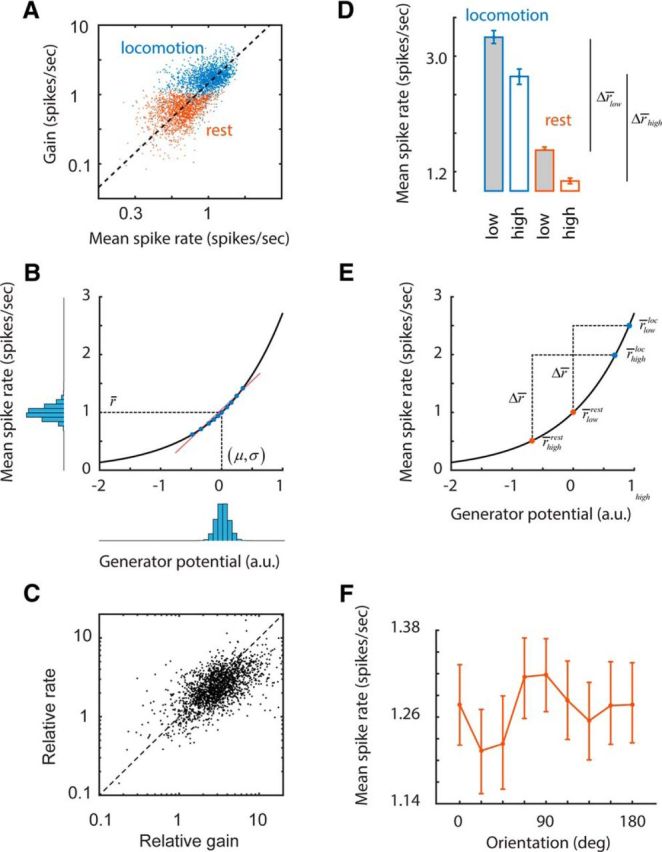
Changes in the operating point of neurons may explain differential gain changes. A, Scatter plot of the mean rate and gain of cells during periods of rest and locomotion. The dashed line represents the best linear fit. B, An exponential spiking nonlinearity with a Gaussian input has the property that the mean response is proportional to the gain, consistent with the data in A. Here, r̄ represents the mean spike rate and (μ, σ) represent the mean and SD of the generator potential. The blue filled dots represent a small subset of data of the joint distribution of the generator potential and the mean spike rate as related by the nonlinearity. The red line represents the best linear fit to these points. The slope of this line is the gain. C, As predicted by this simple rectification model, relative changes in gain are closely related to relative changes in mean spike rate. D, Cells with low- and high-spatial-frequency preferences have different operating points during rest and locomotion. The relative ordering of these rates, along with the approximate identity relationship shown in C, explain how differential gain increases may occur. E, Graphic summary of the relationship in D depicting the relative positioning of operating points of cells with low- and high-spatial-frequency preferences along the spiking nonlinearity. F, There is a trend of mean rate with orientation that complements the dependence of relative gain with orientation (Fig. 3B), consistent with the proposed explanation based on the shifts of the operating points.
