
Figure 5.
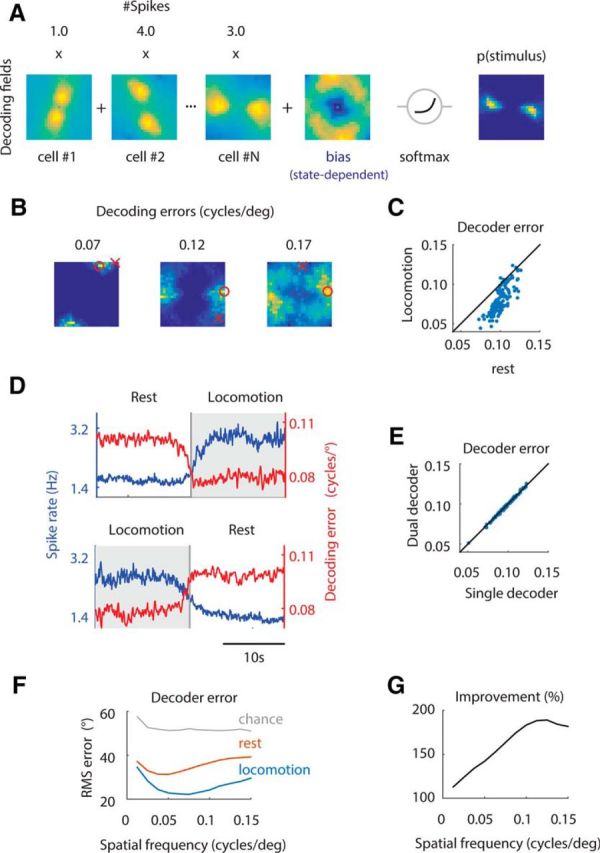
Locomotion enhances the population code and the cortical representation of high spatial frequencies. A, The decoder consisted of the linear weighting of decoding fields by spike rates over the Fourier domain plus a state-dependent bias term, followed by a soft-max nonlinearity (Materials and Methods). The result is an estimate of the probability of the stimulus given the population firing rate, p(stimulus). B, Examples of p(stimulus), along with the estimated (red circle) and presented (red cross) stimuli together with the decoding error measured as the Euclidean distance between these two points on the Fourier plane. C, Decoding error is smaller during locomotion compared with during rest. D, Average changes in population spike rate and decoding error during transitions from rest to locomotion (top) and from locomotion to rest (bottom). E, A single decoder that only modifies the bias in a state-dependent manner performs as well as two separate decoders for each state. In other words, there is no increase in performance if we allow the model to fit different Fourier kernels during locomotion and rest. F, Decoding of orientation as a function of behavioral state and spatial frequency. Gray line represents chance performance. The lowest decoding errors are achieved during locomotion. G, Relative improvement of decoder performance during locomotion versus rest. The relative improvement, in percentage, is defined as 100 * (RMS_loc − RMS_chance)/(RMS_rest − RMS_chance). The relative improvement in decoding accuracy is concentrated at high spatial frequencies, where gain increases are more pronounced.