Fig. 3.
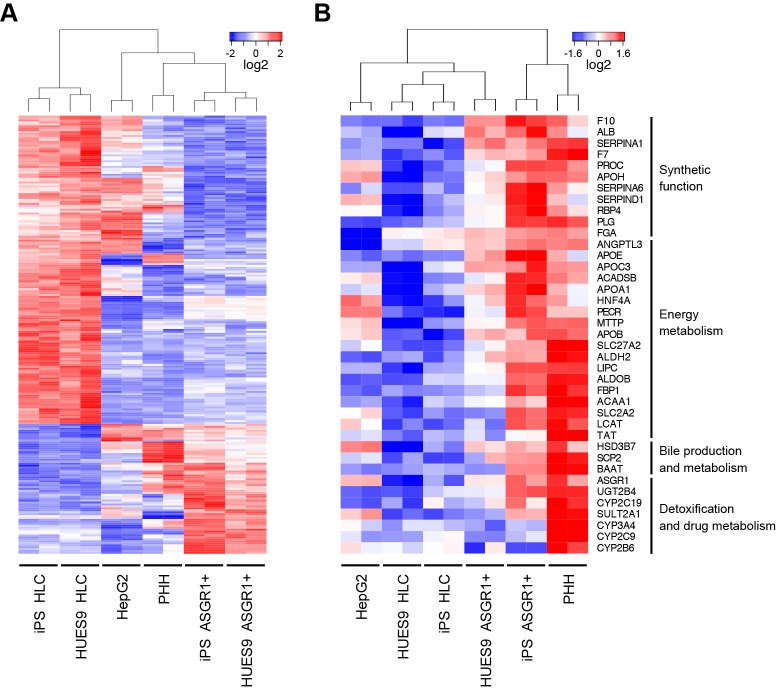
Global transcriptional analysis shows that ASGR1-positive cells share a distinct transcriptional profile and are more similar than unsorted HLCs to adult hepatocytes. (A) ASGR1-positive cells and HLCs differentiated from two different hPSC lines were compared with HepG2 hepatoma cells and adult primary human hepatocytes (PHHs) using microarrays. Shown is a heatmap of hierarchical clustering performed on genes differentially expressed more than 2-fold between ASGR1-positive cells and HLCs at a 5% FDR. 226 probe sets were differentially expressed greater than 2-fold between ASGR1-positive and unsorted HLCs at 5% FDR; 67 upregulated and 159 downregulated in ASGR1-positive versus unsorted HLCs. (B) Heatmap and hierarchical clustering of a panel of genes related to characteristic hepatic functions across the same samples as in A. Blue, below-average expression, red, above-average expression.

