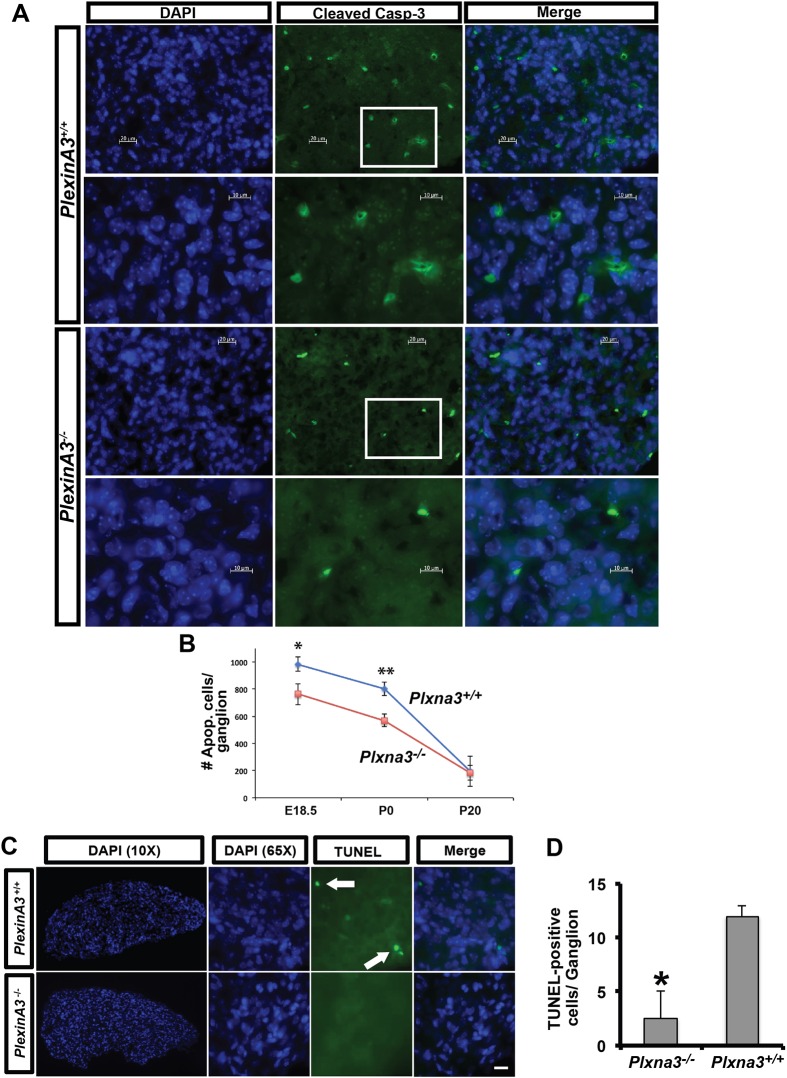
Fig. 6.
Programmed cell death is reduced in the SCG of Plxna3 knockout mice. (A) Activated caspase 3 immunofluorescence labeling (green) revealed a decrease in the number of apoptotic neurons in the P0 SCG of Plxna3−/− compared with Plxna3+/+ mice. Nuclei are stained with DAPI (blue). Boxed regions are shown at higher magnification in the lower row for each genotype. (B) The analysis in A was performed on E18.5 (n=5 for each genotype), P0 (n=4 for each genotype) and P20 (n=4 for Plxna3+/+ and n=5 for Plxna3−/−) SCG and activated caspase 3+ cells per ganglion quantified; mean±s.e.m. (C) TUNEL staining of Plxna3+/+ and Plxna3−/− SCG was performed on P1-P2 mice (n=3 for both genotypes). Arrows indicate TUNEL+ cell bodies. (D) Quantification of the number of TUNEL+ cells per ganglion from C; mean±s.e.m. (B,D) *P<0.05, **P<0.01, Student's t-test. Scale bars: 20 μm in C, and in A rows 1 and 3; 10 μm in A rows 2 and 4.

