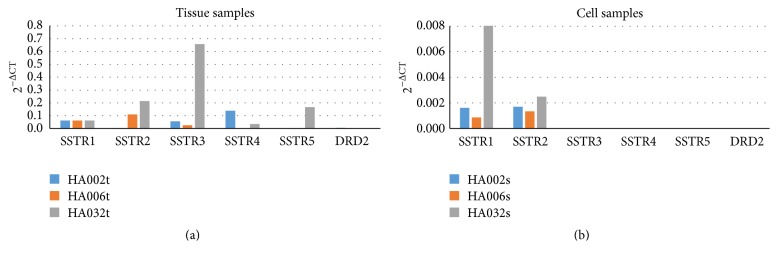
Figure 8.
Somatostatin and dopamine receptor expression in tissue samples (a) and corresponding cell cultures (b). Values are calculated using comparative (2−ΔCt) method and mean Ct values from experiments performed in triplicate. Although adenoma tissue samples showed meaningful expression of somatostatin and dopamine receptors (a), their expression in cell cultures was not substantial (b). SSTR1–5, somatostatin receptors 1 to 5; DRD2, dopamine receptor D2.

