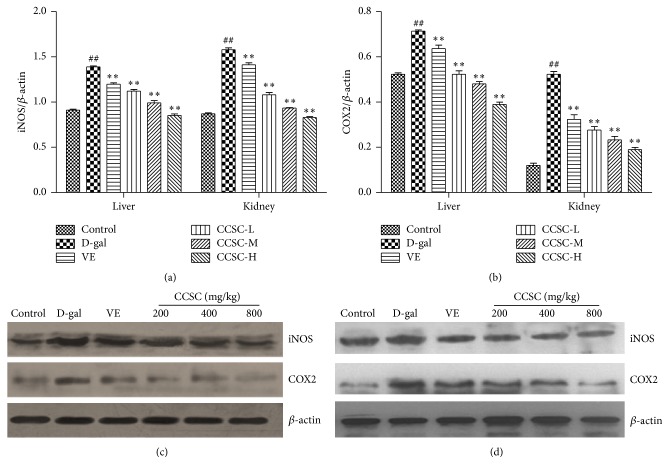
Figure 4.
Western blotting analysis of iNOS and COX2 protein expression in the liver and kidney tissues. Relative density analysis of iNOS (a) and COX2 (b) and the representative images of expression of iNOS and COX2 in the liver (c) and kidney (d) tissues. The relative protein level between the tested target protein and internal standard β-actin was calculated and labeled on the y-axis. The bands are from a representative blot. Lane-1: control group; lane-2: D-gal-treated group; lane-3: VE-treated group (80 mg/kg); lane-4: CCSC-L-treated group (200 mg/kg); lane-5: CCSC-M-treated group (400 mg/kg); lane-6: CCSC-H-treated group (800 mg/kg). Values are expressed as mean ± SD in each group. ## P < 0.01 as compared with the control group; ∗∗ P < 0.01 as compared with the D-gal group, n = 3.

