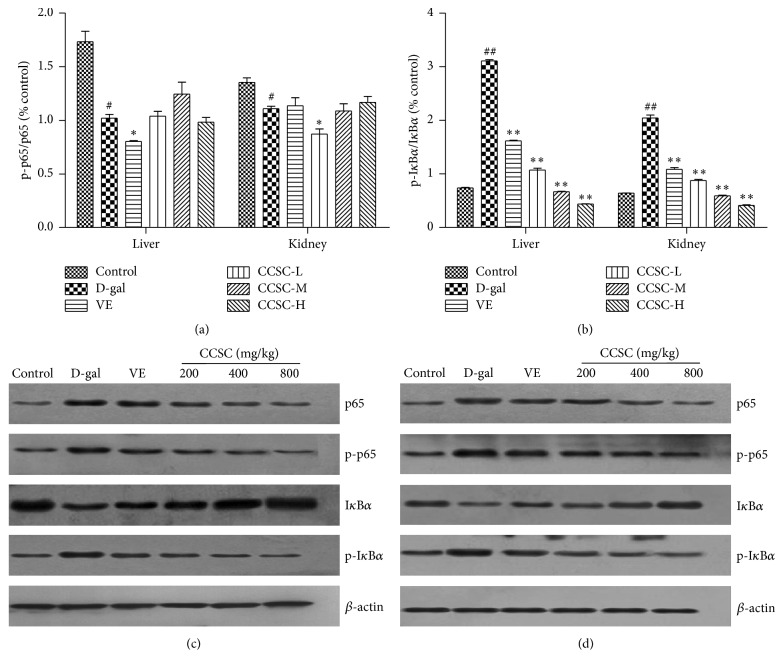
Figure 5.
Effect of CCSC on the protein expression of NF-κB pathway. Relative density analysis of p-p65/p65 (a) and p-IκBα/IκBα (b) and the representative images of p-IκBα, IκBα, p-p65, and p65 expression in the liver (c) and kidney (d) tissues. The relative protein level between the tested target protein and internal standard β-actin was calculated and labeled on the y-axis. The bands are from a representative blot. Lane-1: control group; lane-2: D-gal-treated group; lane-3: VE-treated group (80 mg/kg); lane-4: CCSC-L-treated group (200 mg/kg); lane-5: CCSC-M-treated group (400 mg/kg); lane-6: CCSC-H-treated group (800 mg/kg). Values are expressed as mean ± SD in each group. # P < 0.05 and ## P < 0.01 as compared with the control group; ∗ P < 0.05 and ∗∗ P < 0.01 as compared with the D-gal group, n = 3.

