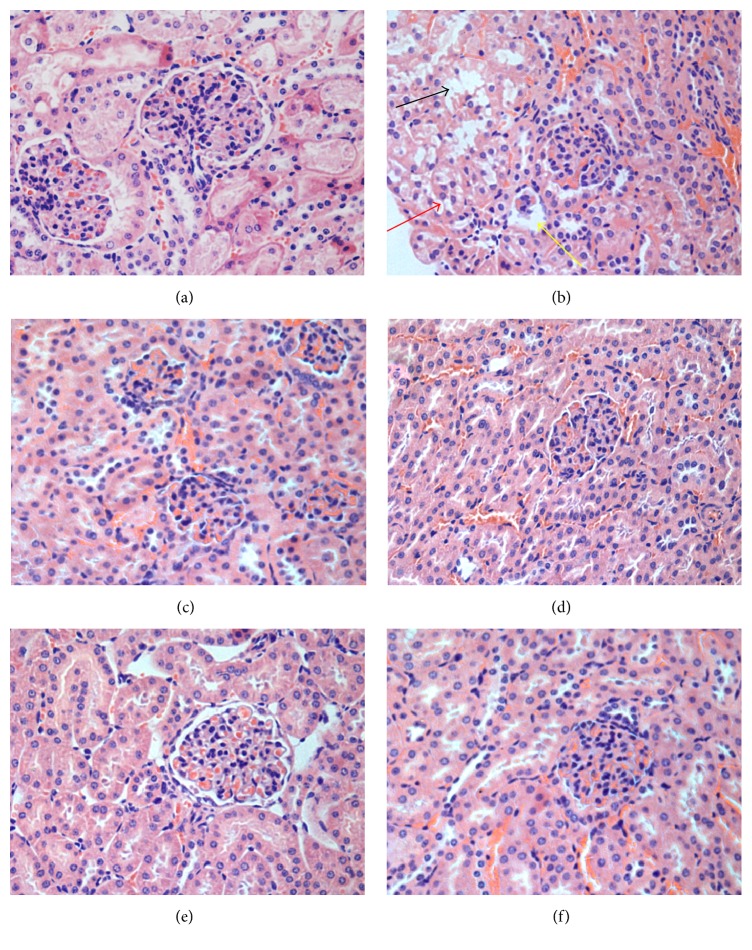
Figure 7.
Histopathological appearance of kidney (H&E staining 400x). (a) Control group, (b) D-gal (200 mg/kg) group, (c) VE (80 mg/kg) group, (d) CCSC-L (200 mg/kg) group, (e) CCSC-M (400 mg/kg) group, and (f) CCSC-H (800 mg/kg) group. Atrophy (yellow arrow), balloon widened cavity (red arrow), and drop of epithelial cells in renal proximal convoluted tubules (black arrow).

