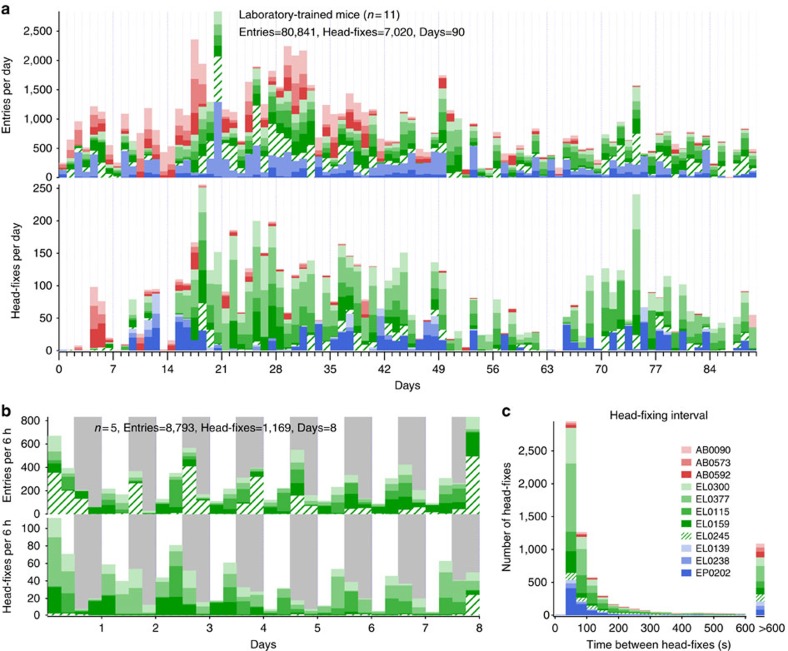
Figure 2. Laboratory-trained mice frequency of head-fixing and entrances.
(a) Time course showing daily totals for entries and head-fixes for 11 mice represented in different colours. Two cages of three mice EP (shown in shades of blue) and AB (red) and one of five mice EL (green); all mice were head-fixed. (b) Graph showing frequency of head-fixation for five unsupervised mice assessed 24 h per day for 8 days in 6-h bins (grey shading indicates night). (c) Measure of repeat head-fixing frequency determined from the time interval between head-fixes. Data from 11 mice in cage groups named EP, EL and AB are shown. Most repeated head-fixes occur within minutes of a previous head fixation.

